What Is Cup and Handle?
What is a cup and handle pattern? A rounded base followed by a shallow pullback that signals potential continuation in growth stocks.
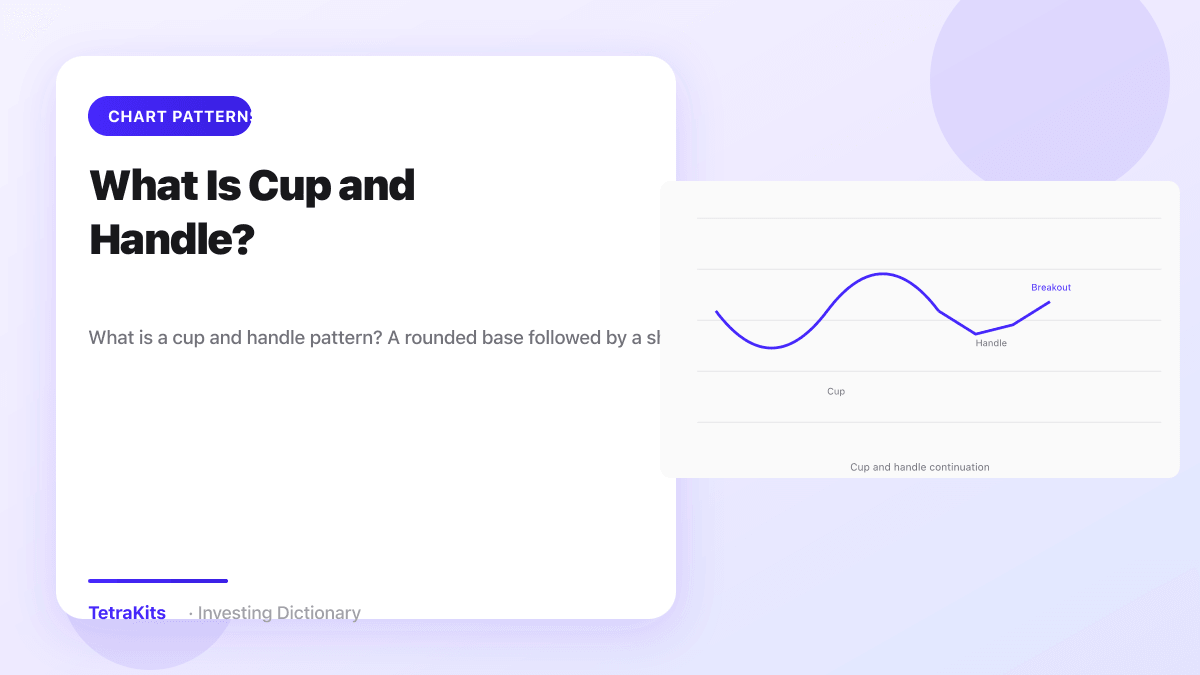
A cup and handle is a bullish continuation chart pattern where price forms a rounded U-shaped base called the cup, then drifts lower in a smaller pullback called the handle, before breaking out to resume an uptrend. The cup reflects a gradual shift from selling to absorption to renewed demand. The handle is a final shakeout or pause that tests whether buyers will defend the upper part of the base. Popularized in momentum investing circles, the pattern is most meaningful when you read it on a full chart with adequate base depth, time, and volume character rather than as any shallow dip and bump.
Cup depth, handle drift, and what to look for
On a daily or weekly chart, start with a prior advance that cooled into a correction. The left side of the cup is the decline from the old high. The bottom should round rather than V-bottom sharply, suggesting supply was absorbed over time instead of in one panic flush. The right side of the cup is the recovery toward the prior high. Many guides want the cup to retrace roughly one-third to one-half of the prior uptrend, though real examples vary. Extremely shallow cups may lack enough base building to support a durable breakout.
The handle forms on the right side of the cup when price pulls back modestly from the cup rim area. It should drift lower or move sideways in a tight range, not erase the cup gains. Depth of the handle matters: a shallow drift shows strength, while a deep handle that returns near the cup low may signal a failing base. Duration guides often cite weeks to months for the cup on dailies and several days to a few weeks for the handle, but scale your expectations to the asset and time frame you trade.
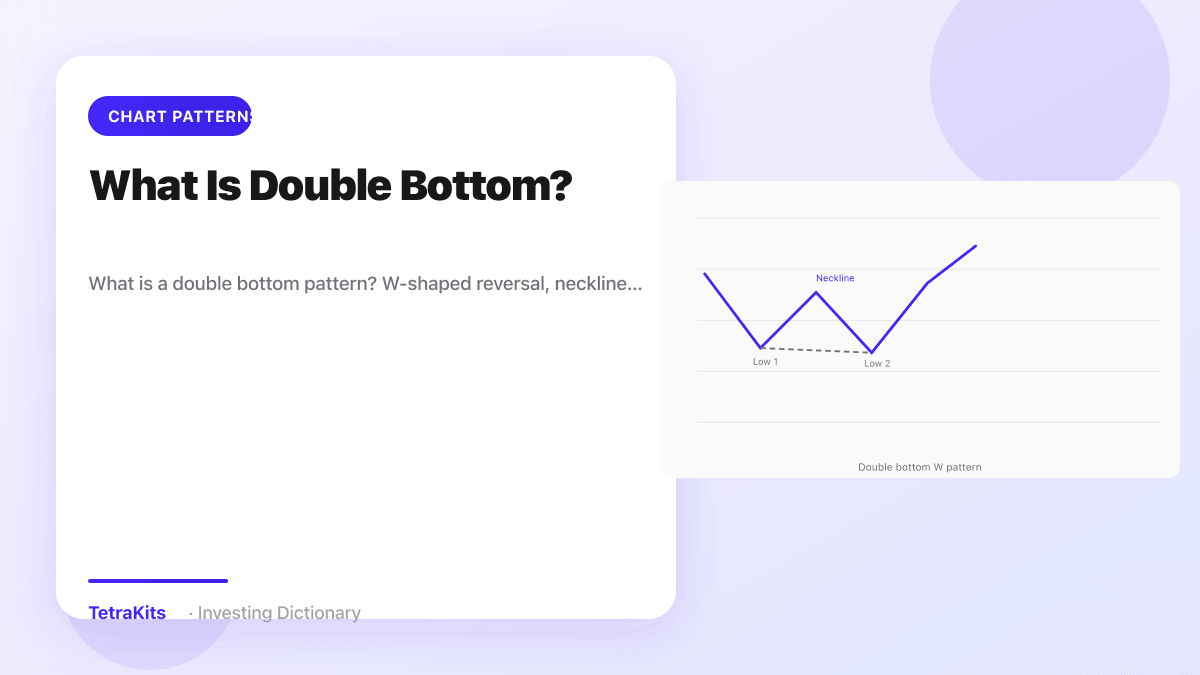
Volume story adds context. Declines on the left cup wall may show heavy selling that eases near the cup bottom. Advances on the right wall may pick up as buyers return. Volume often contracts inside the handle as the market pauses, then expands on the breakout above the handle high. Compare with a double bottom when the cup low shows two distinct troughs: the narratives overlap, but cup and handle emphasizes the rounded recovery and the handle pause before continuation.
Breakout, measured target, and full-chart reading
Confirmation for many traders is a close above the handle high with volume above recent average. The breakout should show follow-through: strong close, hold on retest, and no immediate collapse back into the handle. Entry tactics vary. Some buy the close above the handle; others wait for a retest of the handle high that holds as support. Stops commonly sit below the handle low or below the cup midpoint if you accept wider risk for a larger base.
Measured move targeting uses cup depth. Measure from the cup low to the rim or breakout area and project that distance upward from the breakout point. If the cup low sits near $80 and the rim near $100, a twenty-dollar depth projects a guide near $120 after clearance above the handle. Real markets may stop at round numbers, prior supply, or extend further in strong momentum tapes. Treat the projection as planning math, not a guarantee.
The illustration below shows the cup and handle on a complete chart with rounded base, handle drift, and breakout path, training you to see continuation structure in full context rather than as a lone U shape on a few sessions.

Failed bases, risk, and common mistakes
Invalidation often comes when price breaks below the handle low or fails to hold the cup right side on retest. A breakdown through the cup low converts the setup into a deeper correction, not a continuation. Gap risk around earnings matters for growth names where this pattern appears often. Size positions knowing handles can whipsaw before the true break. Partial entries on breakout with adds on retest balance confirmation against opportunity cost.
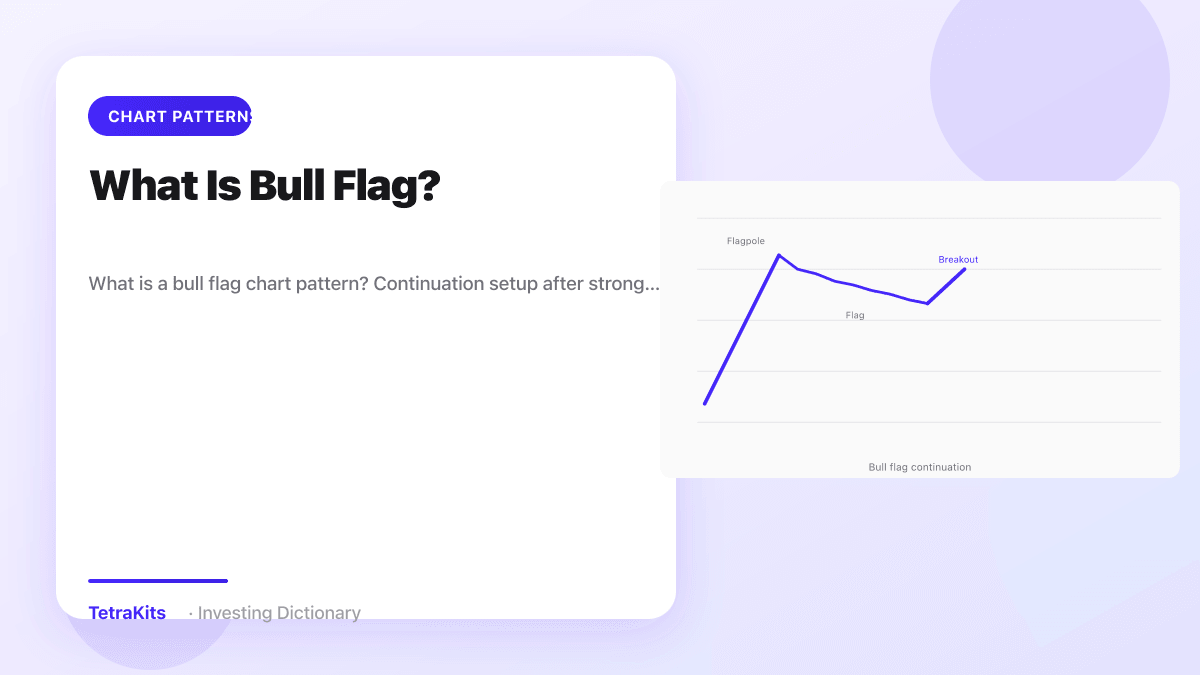
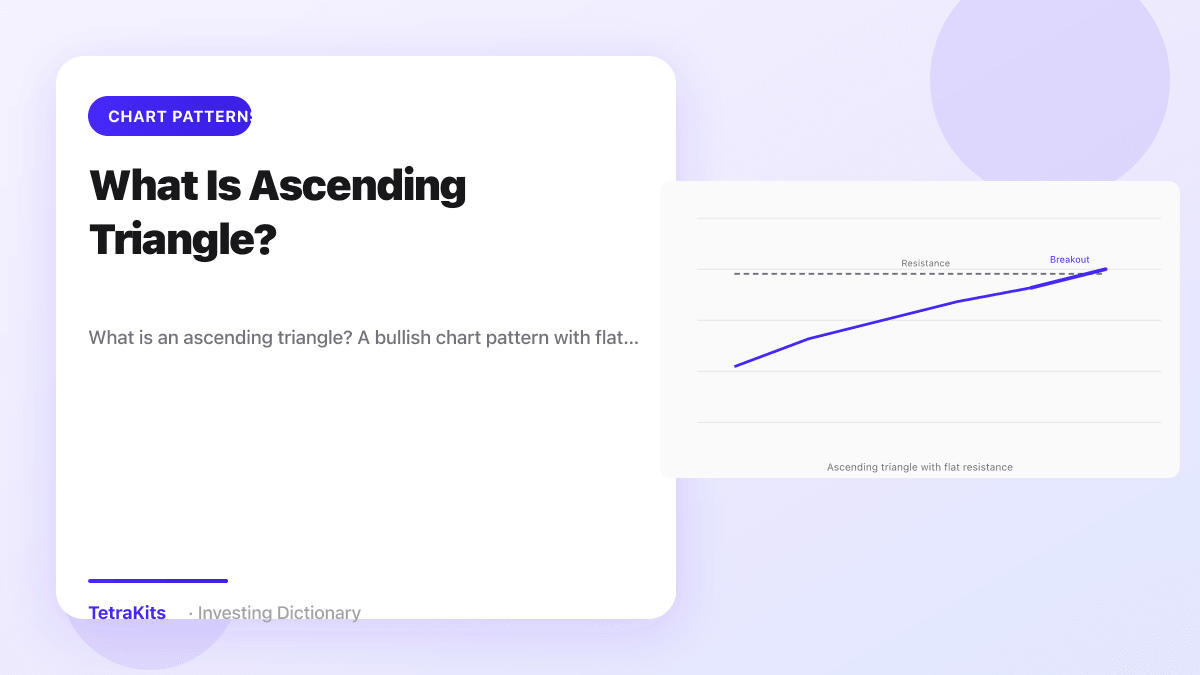
Relate cup and handle to nearby patterns. An ascending triangle can form if the handle tightens under flat resistance instead of drifting lower. After breakout, a bull flag may appear as the next consolidation leg higher. Candlestick support at the cup low, such as a hammer or bullish engulfing, can add evidence that demand defended the base.
Common mistakes include labeling every rounded pullback a cup without adequate depth and time, tolerating handles that retrace most of the right cup wall, and chasing breakouts far above the handle after a vertical gap where risk-reward collapses. Another error is ignoring the primary trend and market tide: a pretty cup on one name can fail when the index rolls over. Read the full chart, demand volume contraction in the handle and expansion on the break, place stops under the handle low, use cup depth for target guides, and respect failed bases as warnings to step aside until a new structure forms.
Common questions
How long should a cup take?
Guides often cite weeks to months on daily charts; very shallow cups may lack sufficient base building.