What Is Bull Flag?
What is a bull flag chart pattern? Continuation setup after strong rallies, flagpole and consolidation rules.
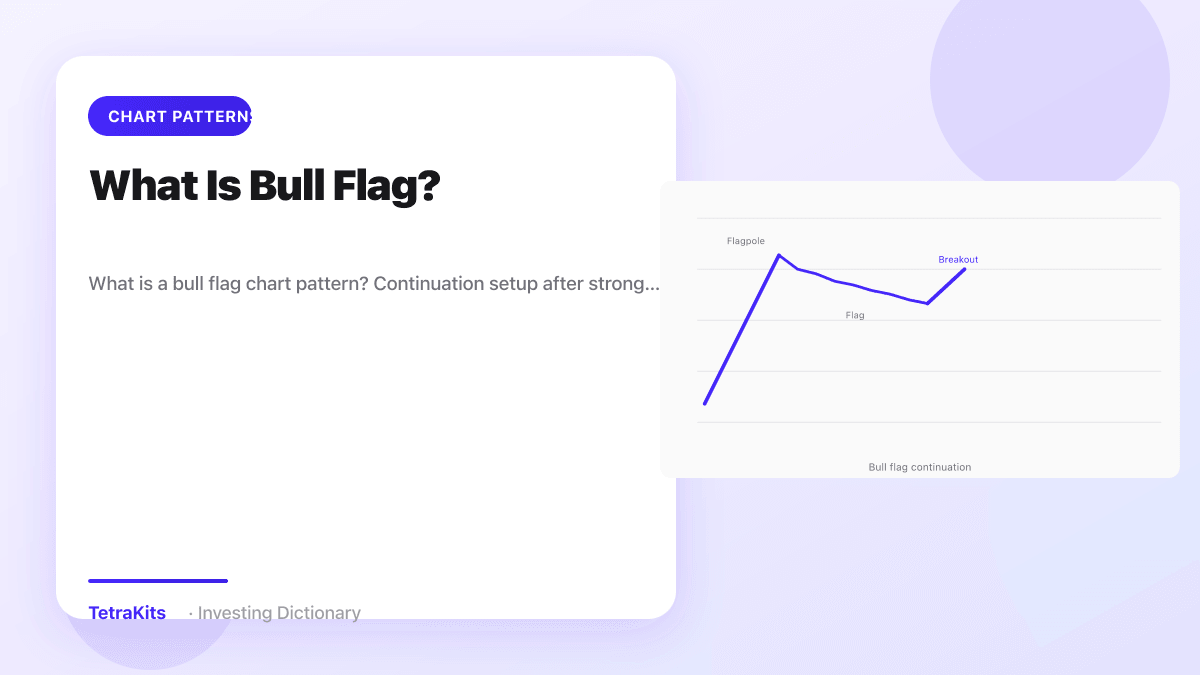
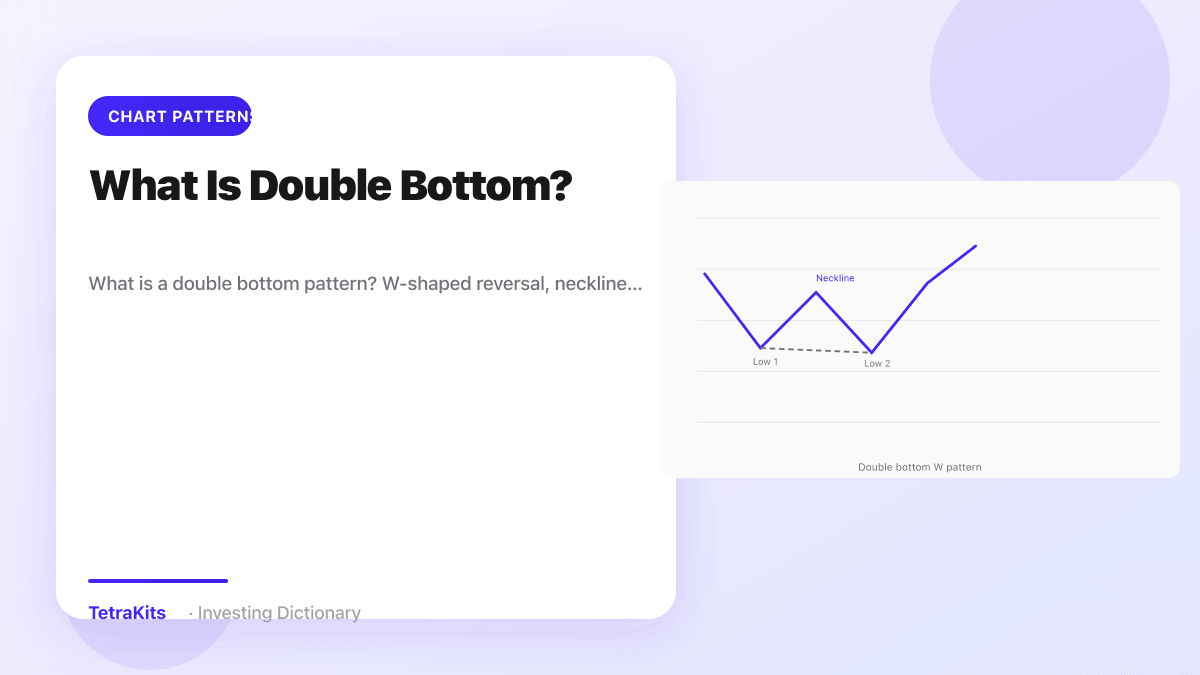
A bull flag is a continuation chart pattern that appears after a sharp upward move called the flagpole, followed by a brief consolidation that slopes slightly downward or sideways like a flag on a pole. It suggests buyers paused to digest gains before the prior uptrend resumes. The pattern is bullish only when the broader trend context supports higher prices and when breakout volume confirms that demand returned. Reading the flag on a full chart with the flagpole, consolidation depth, and volume trend separates real continuations from exhausted spikes.
Flagpole, consolidation, and what to look for
Start by identifying the flagpole: a steep, often nearly vertical rally on expanding volume or a strong gap driven by news, earnings, or sector momentum. After the pole, price should pull back in an orderly channel rather than reversing the entire move. The flag typically drifts lower or moves flat while highs and lows compress. Duration is shorter than the pole in classic teaching: a few days on intraday charts, one to three weeks on dailies for many swing setups.
Depth of the flag matters. Shallow pullbacks that retrace a small fraction of the pole show strength. Deep flags that give back most of the rally may be failing continuations or rounding into tops. Draw parallel lines along the flag highs and lows. A clean downward slope with contained volume often fits the bull flag label. Choppy, overlapping bars with wild wicks may be simple consolidation without a tradable edge.
Volume should dry up inside the flag as urgency fades. That contrast with the pole is part of the story: excitement on the advance, patience on the pause. When volume picks up again on a break above the flag upper trendline, continuation traders gain evidence that buyers reasserted control. Breakouts on thin volume are more prone to fail, especially in thinly traded names.
Breakouts, measured targets, and chart context
Entry tactics vary. Some traders buy a close above the upper flag boundary; others wait for a retest of the broken line that holds. Stops commonly sit below the flag low or below the last higher low inside the consolidation. Because the pole was fast, slippage and gap risk can be large around catalysts. Size positions knowing the flag low is the logical invalidation point.
Measured move projection adds a target framework. Measure the flagpole height from its start to its peak and project that distance upward from the breakout point. If the pole lifted price from $50 to $65, a fifteen-dollar height projects another fifteen dollars from the breakout near $62 toward $77 as a guide. Markets may stop at prior resistance or extend further in momentum regimes. Treat the projection as a planning tool, not a certainty.
The chart below shows the bull flag with pole, sloping consolidation, and breakout path on one canvas so you practice seeing continuation structure in full context rather than as a lone triangle snippet.

Bear flag mention, risks, and common mistakes
The bear flag is the bearish mirror after a sharp decline: a flagpole down, then a slight upward or sideways consolidation, then a breakdown that continues the downtrend. Recognizing both versions keeps you from bullish bias on every pullback channel. In bear flags, volume often fades on the relief bounce and expands on the breakdown. The same measured-move math projects downward from the break.
Relate bull flags to other patterns when they nest. A breakout from a double bottom can create the pole, with the flag as a secondary entry. Late-stage bull flags near long-term resistance deserve caution even if the shape looks tidy. Candlestick rejections such as a shooting star at the flag high can warn that supply appeared before the break.
Common mistakes include chasing the flagpole after it is already extended, drawing flags on every small pause after a green day, and ignoring the market tide when index trend turns lower. Another error is placing stops inside the tight flag where normal noise triggers exit before breakout. Wide poles in low-float stocks can retrace violently and stop out disciplined traders anyway. Read the full chart, confirm volume dry-up in the flag and expansion on the break, define risk under the flag low, use measured moves as guides, and remember bear flags apply the same logic after sharp drops.
Common questions
Bear flag?
Mirror image after sharp drop; breakdown continues downtrend.