What Is Shooting Star?
What is a shooting star candlestick? Bearish reversal signal after uptrends, with diagram and trading notes.
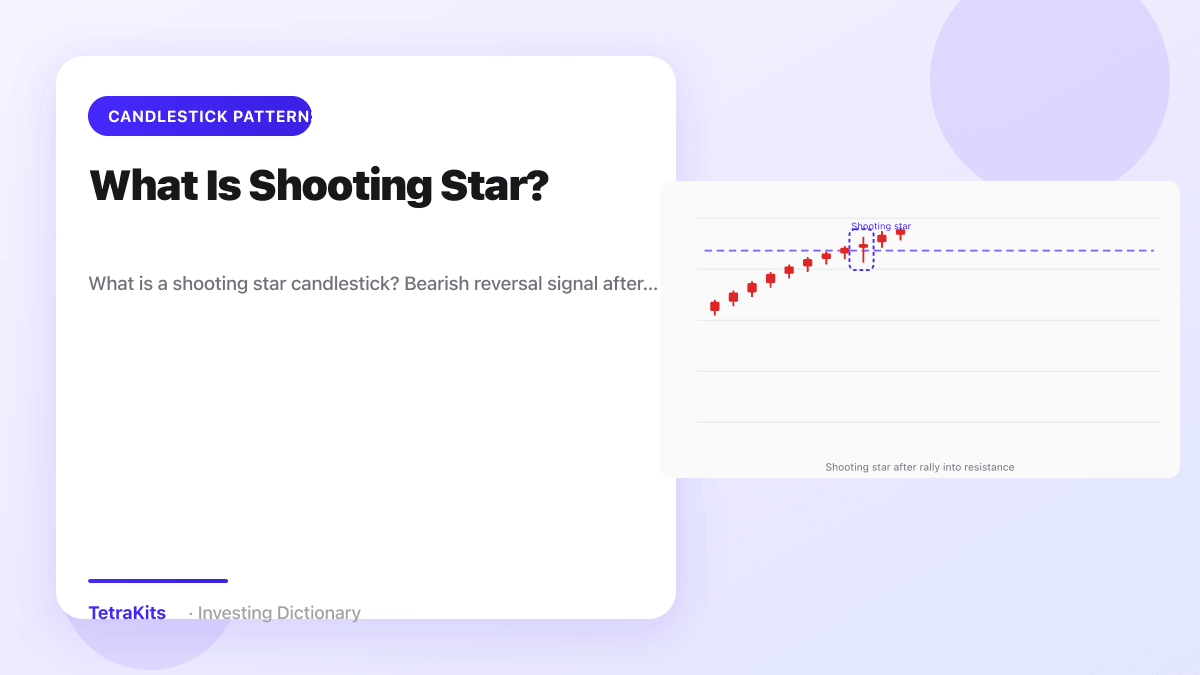
A shooting star is a bearish reversal candlestick that forms after an uptrend or rally, featuring a small real body near the low of the session and a long upper shadow at least two to three times the body size. It indicates buyers pushed price higher intraday, but sellers overwhelmed them by the close, leaving a footprint of rejection at the highs. The pattern warns that upside momentum may be fading. It is not a standalone short signal until confirmation and chart context align.
Why rallies produce shooting stars
Markets rise when demand outruns supply. Near resistance or after an extended run, late buyers often chase while early holders sell into strength. A shooting star captures that intraday tug-of-war: the long upper wick shows where price was rejected, and the small body near the bottom shows sellers finished in control. On a full chart, look for the pattern at the end of a leg higher, especially where prior highs, trend channels, or round numbers cluster.
Volume tells you whether the rejection mattered. Climax volume on the shooting star day can mean distribution: large players sold into retail enthusiasm. Average volume with a long wick may still work if the level is obvious, but follow-through becomes essential. Compare the shooting star high to recent swing highs. A marginal new high that fails to hold often pairs well with the candle shape.
Distinguish shooting star from inverted hammer, which uses the same geometry but appears after a decline. Inverted hammer suggests buyers tested lower prices and pushed back, a tentative bullish hint at support. Shooting star appears after advance and warns of supply overhead. Trend location is the entire difference. Calling a post-rally candle an inverted hammer is a common labeling mistake that flips the bias.
Reading shooting stars on a full chart
Do not trade screenshots of a single red candle with a long wick. Open the daily or weekly chart, identify the rally that preceded the signal, and mark resistance zones. A shooting star under a ceiling where price failed twice before deserves more respect than one in the middle of a trend with no nearby barrier. Notice the candles before it: several strong green bars into the level set up exhaustion; a shooting star after one green day in a chop zone may mean little.
Confirmation separates warning from action. Many traders wait for the next session to close below the shooting star body or below its midpoint before reducing longs or entering shorts. A gap down after the pattern strengthens the bearish case. If price immediately takes out the shooting star high on volume, the signal failed and the uptrend may accelerate. That clear invalidation above the wick is valuable for risk control.
The diagram below embeds the shooting star inside a completed rally and resistance context so you practice seeing wick rejection as part of the broader structure, not as an isolated icon.

Stops, related patterns, and mistakes
Risk reference for bearish trades often sits above the shooting star high, sometimes with a buffer. The wick marks where buyers lost the session; a move above it suggests they regained control. Position size should reflect the distance from entry to stop, especially in volatile names where wicks are wide. Profit targets may aim at the last swing low, a broken support retest, or a measured move from the recent rally base.
Related candlesticks enrich the read. A doji at resistance followed by a shooting star shows indecision resolving lower. A hammer after a decline is the bullish cousin by location, not by shape. Pair shooting stars with chart patterns when they overlap: a shooting star at the right shoulder area of a head and shoulders top adds confluence, though either signal alone still needs confirmation.
Common mistakes include shorting every shooting star in a strong bull market where dips are bought quickly, ignoring the time frame, and confusing the pattern with a spinning top that has shadows on both sides without a dominant upper wick. Another error is neglecting macro catalysts: a shooting star before a known positive event may fail because fundamentals overpower short-term candles. Read the full chart, respect resistance, wait for follow-through, place stops above the wick, and remember inverted hammer at bottoms is the bullish mirror by context, not by anatomy.
Common questions
Shooting star vs inverted hammer?
Same shape; shooting star after rally (bearish), inverted hammer after decline (bullish hint).