Chart Patterns
Chart patterns map recurring price structures across time frames. Learn what each shape implies and where traders often place stops and targets.
-
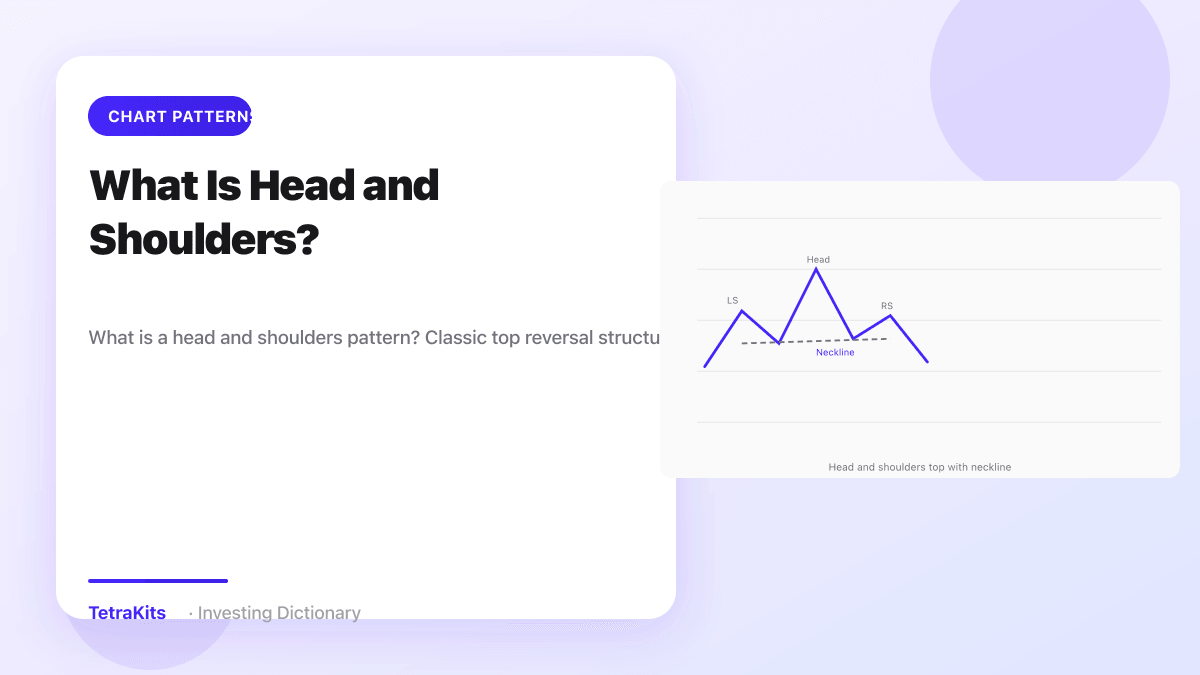 Chart Patterns
What Is Head and Shoulders?
What is a head and shoulders pattern? Classic top reversal structure, neckline breaks, and measured move targets.…
Read definition -
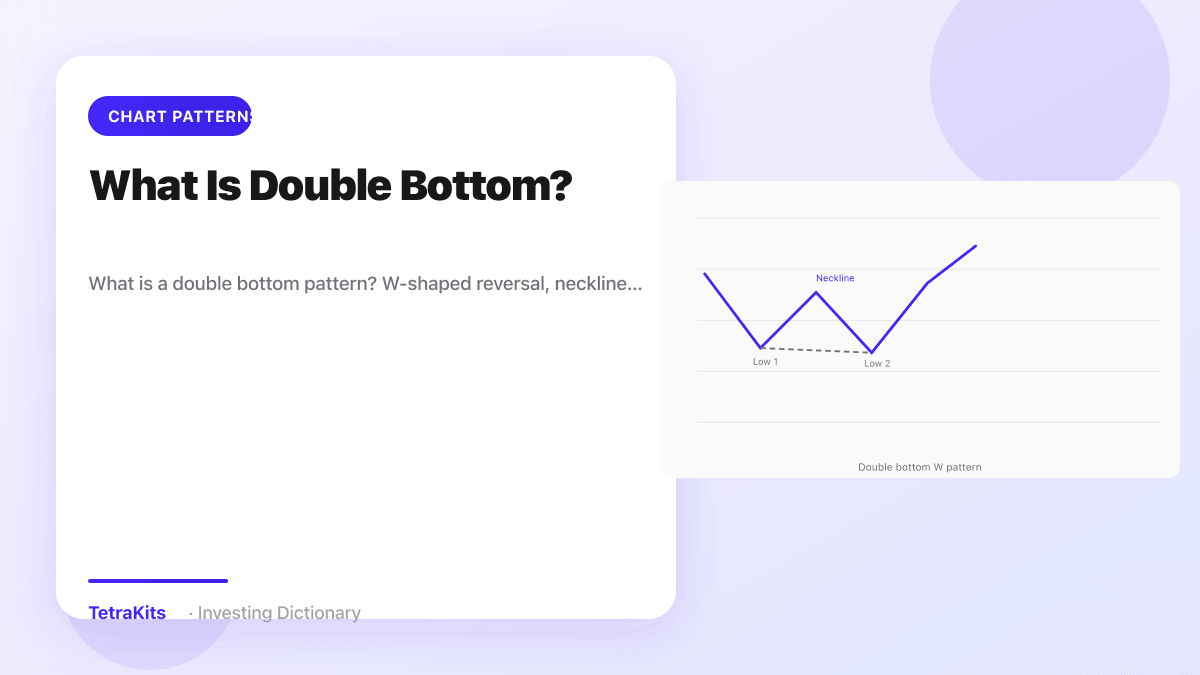 Chart Patterns
What Is Double Bottom?
What is a double bottom pattern? W-shaped reversal, neckline confirmation, and example trade planning.…
Read definition -
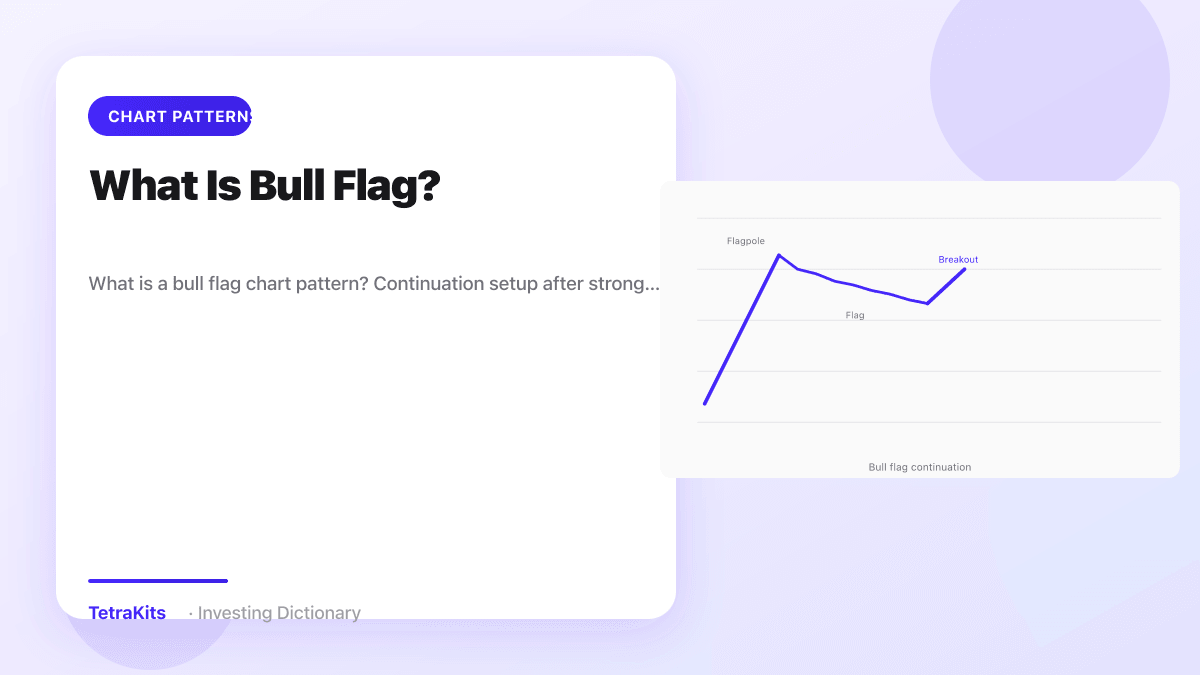 Chart Patterns
What Is Bull Flag?
What is a bull flag chart pattern? Continuation setup after strong rallies, flagpole and consolidation rules.…
Read definition -
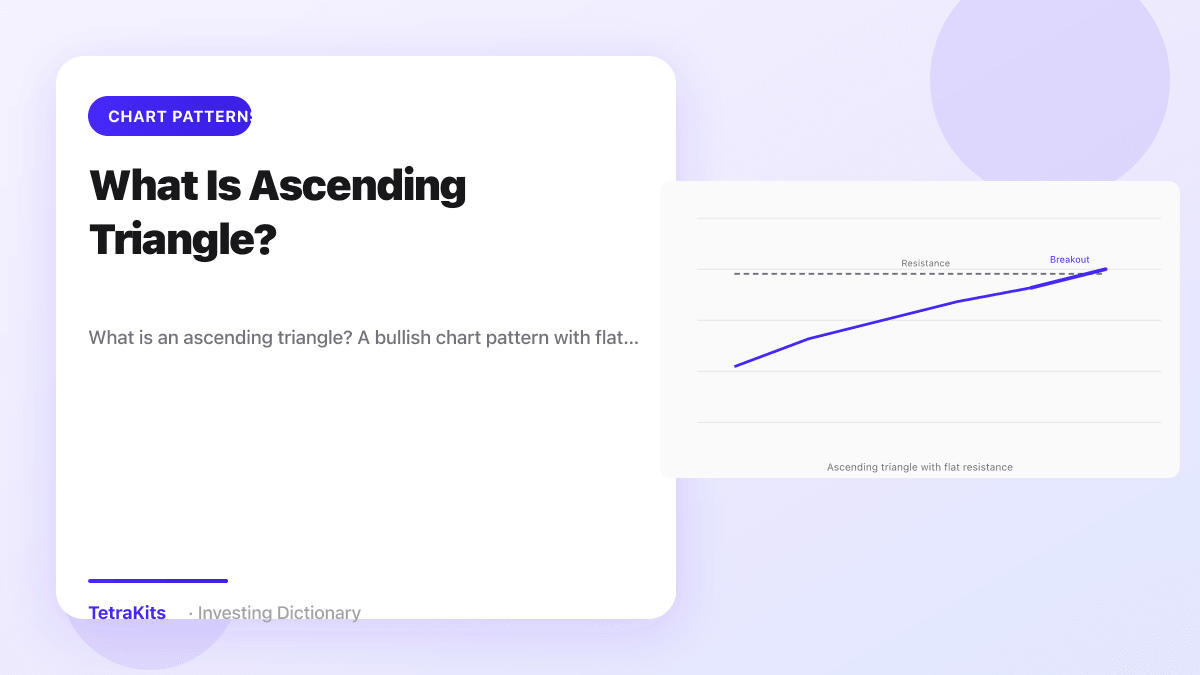 Chart Patterns
What Is Ascending Triangle?
What is an ascending triangle? A bullish chart pattern with flat resistance and rising lows that often resolves with an …
Read definition -
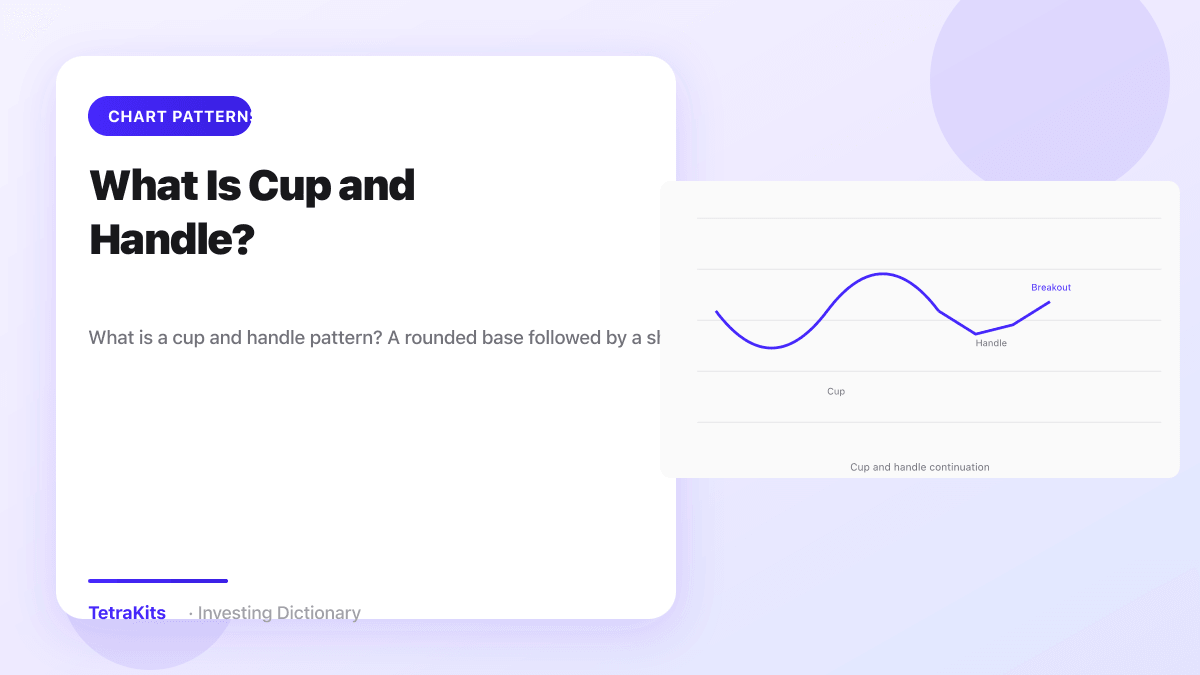 Chart Patterns
What Is Cup and Handle?
What is a cup and handle pattern? A rounded base followed by a shallow pullback that signals potential continuation in g…
Read definition