What Is Head and Shoulders?
What is a head and shoulders pattern? Classic top reversal structure, neckline breaks, and measured move targets.
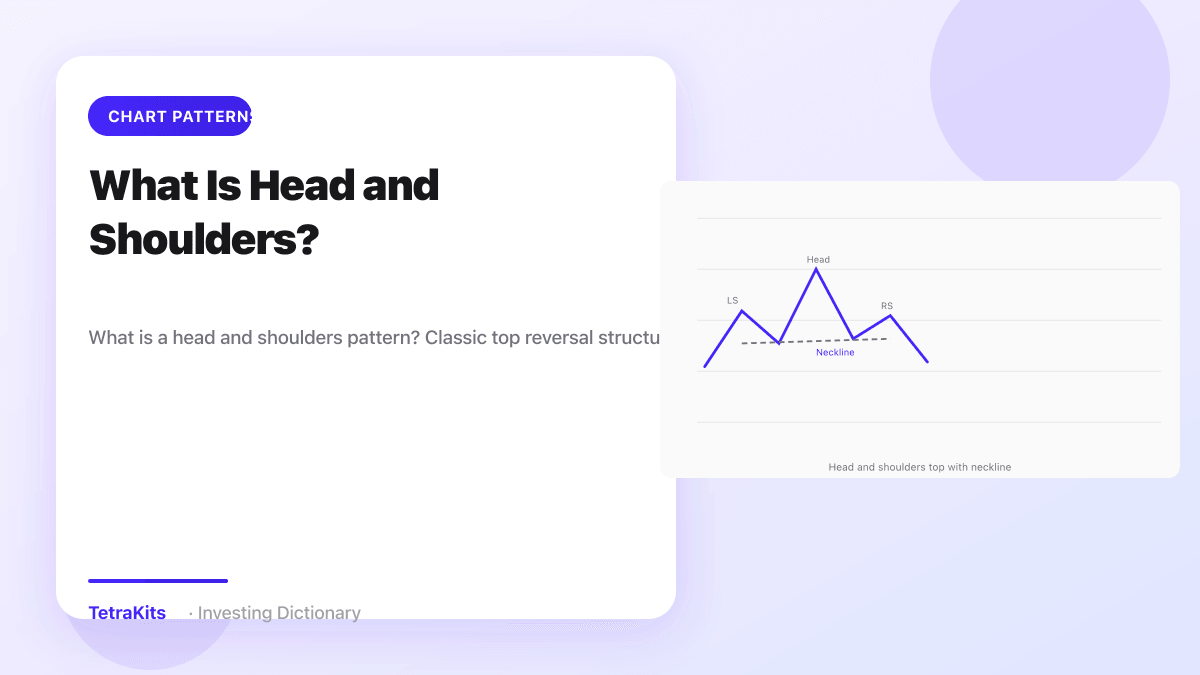
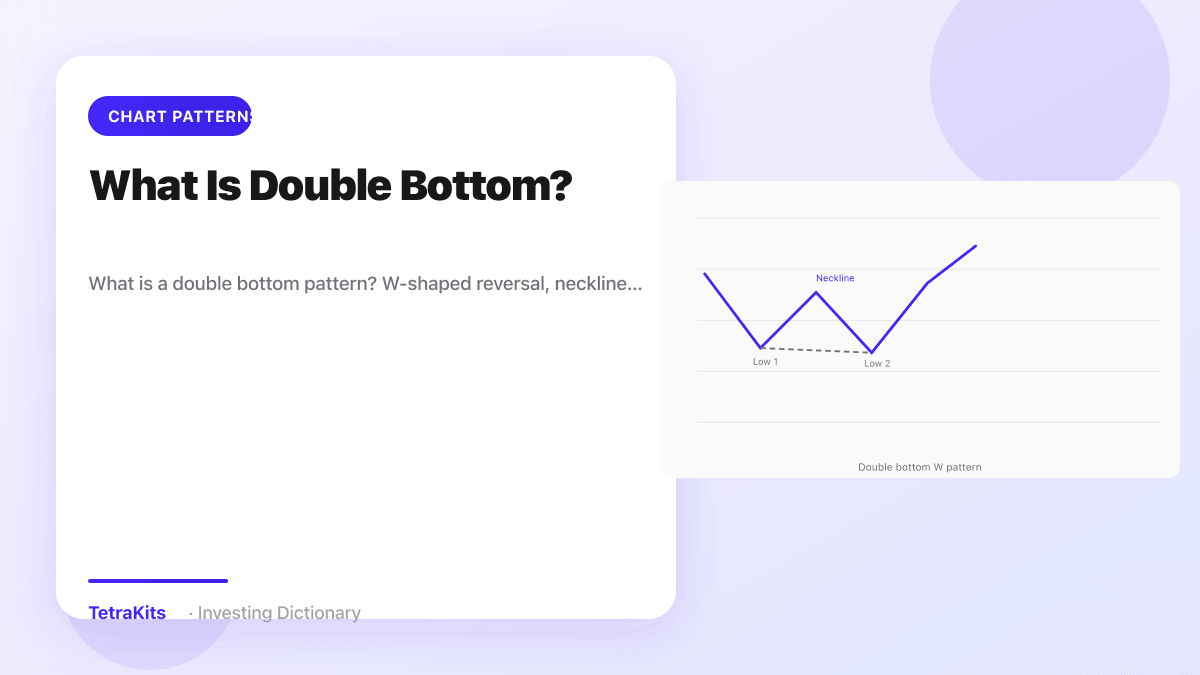
A head and shoulders pattern is a classic chart formation with three peaks where the middle peak, the head, is the highest and the two outer peaks, the shoulders, are lower and roughly similar in height. It often signals that an uptrend is losing strength and that a shift toward lower prices may follow. The pattern is not complete until price breaks the neckline, the support line connecting the lows between the shoulders and the head. Reading it on a full chart with volume and time symmetry matters more than forcing three bumps on every rally.
Three peaks, neckline, and symmetry
On a live chart, start with a mature advance. The left shoulder forms when price rallies to a high, then pulls back to a trough. Price advances again to a higher head, then pulls back to a trough near the depth of the first pullback. A third rally creates the right shoulder, usually peaking below the head and near the left shoulder level. The neckline connects the two troughs. It can slope up, down, or run flat; slope affects how aggressive the breakdown looks but does not change the core idea of trend exhaustion.
Symmetry is a practical filter, not a perfection test. Shoulders that differ slightly in height or spacing still qualify if the overall silhouette reads as three peaks with a dominant center. If the right shoulder towers above the head, you are likely looking at a continuation structure rather than a top. Time matters too: patterns that develop over weeks or months on a daily chart carry more weight than cramped versions on noisy intraday data.
Volume often declines from left shoulder to head to right shoulder as participation thins, then expands on neckline breaks for traders who use volume as confirmation. Not every textbook example shows perfect volume, but a breakdown on rising volume is generally more convincing than one on a quiet drift through support.
Measured move targets and volume on the break
Many traders project a measured move by measuring the distance from the head peak to the neckline and extending that distance downward from the breakdown point. The logic is that the energy built during the topping process may translate into a comparable move once support fails. Treat the target as a guide, not a guarantee. Trends can reverse early at prior demand zones, or momentum can overshoot in panic selling.
Confirmation focuses on the neckline break and follow-through. A single pierce that closes back above the line may be a shakeout. Closes below the neckline, especially with expanded volume, align with the bearish narrative. Failed patterns are real: if price reclaims the neckline quickly, shorts can be trapped and a sharp squeeze may follow. That is why stops and position size should assume both success and failure cases.
Below is a full-chart view of the head and shoulders structure with the neckline and measured move sketched in context, which is how you should study it rather than as three isolated peaks.

Inverse version, trading notes, and mistakes
The inverse head and shoulders is the bullish mirror at market bottoms: three troughs with the middle trough deepest, neckline across the intervening peaks, and a breakout above the neckline as the constructive signal. The same measured-move math projects upward from the breakout. Mentioning the inverse version helps you avoid seeing only tops once you learn the name. Bottoming patterns often take longer to form and may show more violent volume spikes at the head trough during capitulation.
Stops for bearish trades often sit above the right shoulder or above the neckline on a retest that fails. For bullish inverse setups, stops commonly rest below the right shoulder low. Combine the pattern with candlestick clues at the right shoulder: a shooting star or weak rally into the head area can reinforce supply. At bottoms, a hammer or double bottom overlapping the inverse right shoulder can strengthen the bull case.
Common mistakes include drawing necklines through wicks instead of consistent closing levels, labeling every triple top as head and shoulders without a higher head, and entering before the break without a plan for failed patterns. Another error is ignoring the primary trend on higher time frames: a small head and shoulders on a four-hour chart within a strong weekly uptrend may only mark a pullback. Read the full chart, respect volume on the break, use measured moves as guides, and pair the structure with related reversal tools instead of trading geometry alone.
Common questions
Inverse head and shoulders?
Upside-down version at bottoms; neckline break up is the bullish signal.