What Is Hammer Candlestick?
What is a hammer candlestick pattern? Bullish reversal shape, anatomy, and chart examples for swing traders.
A hammer is a single-candle bullish reversal pattern with a small real body near the top of the session range and a long lower shadow at least twice the body length. It suggests sellers drove price lower during the bar, but buyers pushed it back up before the close, leaving a footprint of rejection at the lows. The hammer only earns that bullish label when it appears after a meaningful decline. The same shape after a rally is called a hanging man and carries bearish warning implications instead.
Anatomy, trend context, and the hanging man
On a live chart, open the daily or weekly view and scan the left side of the screen for a downtrend: lower highs, lower lows, or a pullback within a larger bull market that still looks tired. The hammer should print near the end of that decline, not in the middle of a random chop zone. The body can be green or red; purists care more about structure than color. The lower wick should dominate. An upper wick, if present, should stay short. If the body sits in the middle of the range with long shadows both ways, you may be looking at a doji family candle rather than a clean hammer.
Context separates hammer from hanging man. After weeks of selling into a support band, a hammer says dip buyers showed up aggressively. After weeks of rally into resistance, the identical silhouette becomes a hanging man: price probed higher intraday but closed weakly, hinting that overhead supply may be returning. Novice traders memorize the shape and forget the trend. That is how bullish hammers get called in uptrends where they should be read as caution flags. Always read five to twenty prior candles before naming the pattern.
Volume strengthens the story. A hammer on rising volume at support suggests institutional interest defending a level. A hammer on thin volume might be a one-day bounce that fades. Compare the hammer session to the average volume of the last twenty days. Climax volume after a sharp selloff can mark a short-term washout. Quiet volume may still work if the level is well defined, but confirmation becomes more important.
Reading the hammer on a full chart
Isolated candle screenshots mislead. Pull back and mark horizontal support, prior swing lows, moving averages, and trendlines that converge near the hammer low. A hammer that pierces support intraday but closes back above the zone is often more convincing than one that lands in empty air. Notice what happens in the sessions before the hammer. A series of red candles into the level sets up exhaustion. A single hammer after a flat drift may lack energy for a sustained reversal.
Confirmation keeps you out of premature entries. Many traders wait for the next candle to close above the hammer body high before buying. Others want a gap up or a second day that holds the hammer low without retesting it. If price slices through the wick low immediately, the hammer failed and the downtrend likely resumes. That failure case is useful: the invalidation point is objective because the wick defines where buyers lost the battle.
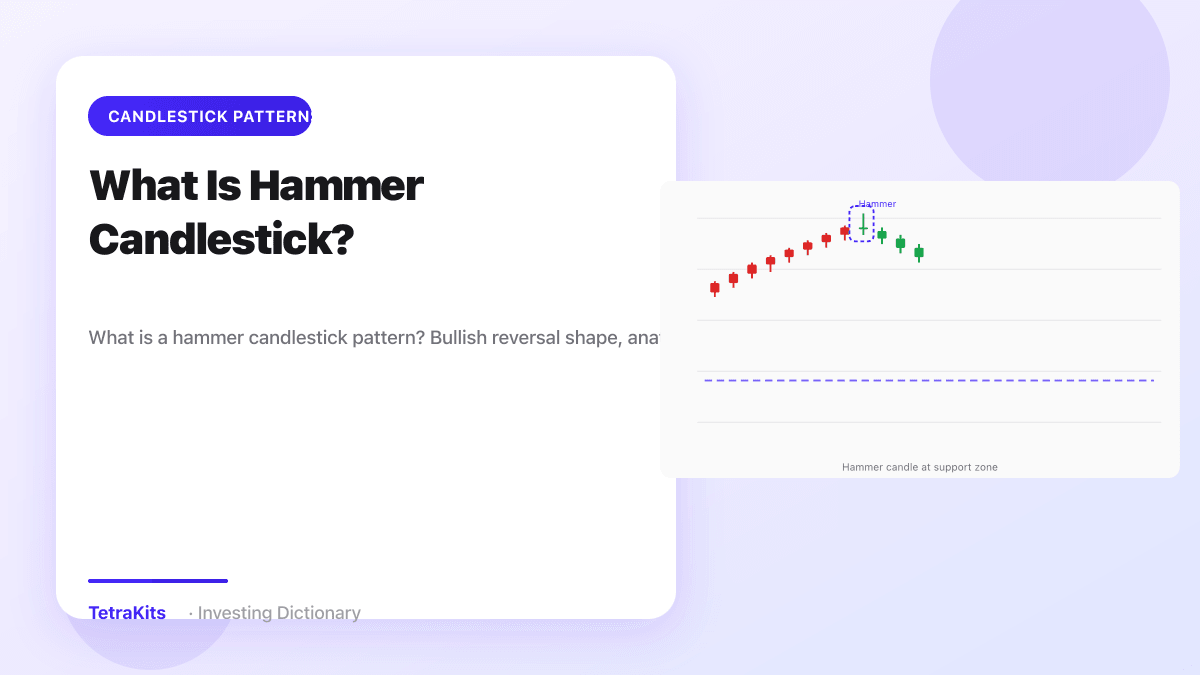
The illustration below places the hammer inside a downtrend and support zone so you can see how wick rejection, prior trend, and room to the upside fit together on one canvas rather than as a lone candle icon.

Stops, targets, and mistakes to avoid
Risk placement is one reason traders like hammers. A common stop sits just below the hammer low, sometimes with a small buffer for spread and noise. Measure entry to stop and size the position so a loss stays within your daily or per-trade limit. Targets often reference the nearest swing high, a broken trendline retest, or a measured move from the base. Hammers are usually swing or position tools on daily charts; on intraday charts the same shape appears constantly and demands stricter filters.
Combine the hammer with related price action when it helps. A hammer at support followed by a bullish engulfing next day adds momentum evidence. A hammer under resistance after an uptrend is not a buy signal; treat it as a hanging man and look for shooting star style weakness or lower highs to confirm distribution. Indicators like RSI rising from oversold territory can support the idea that selling pressure eased, but price structure should lead.
Common mistakes include calling every long lower wick a hammer without a downtrend, buying before confirmation in fast markets, and placing stops inside the wick where normal volatility stops you out before the trade develops. Another error is ignoring the broader market: a valid hammer on one stock may fail when the index gaps down the next morning. Respect the level, demand follow-through, define risk under the wick, and read the full chart instead of the single candle alone.
Common questions
Hammer vs hanging man?
Same shape; hammer appears after decline, hanging man after advance (bearish warning).