What Is Bullish Engulfing?
What is a bullish engulfing pattern? Two-candle reversal setup, rules, and how to trade it with risk controls.
A bullish engulfing pattern is a two-candle reversal formation where a small bearish candle is followed by a larger bullish candle whose real body completely covers the prior body. The second session opens at or below the previous close and finishes above the previous open, signaling that buyers absorbed selling pressure and closed with control. Like every candlestick signal, it matters most when you read it on a full chart after a decline, ideally near support, with volume and follow-through that confirm the shift.
Body engulfing rules and what counts
Classic definitions focus on real bodies, not wicks. The green body of day two must span from below the red body low to above the red body high. Wick overlap is secondary; some strict traders want the second candle to engulf the full range, but most educators emphasize bodies because opens and closes carry the clearest statement of who won the session. Day one should reflect ongoing weakness: a modest red candle in a downtrend fits well. Day two should be wide and decisive relative to recent bars.
Zoom out before you label the pattern. A bullish engulfing in a sideways range is often just noise. A bullish engulfing after five to ten red sessions, printing at a prior swing low or moving average, carries a different message. Check the size of the engulfing candle against the average true range of the last month. A truly large green bar suggests aggressive buying, not a random uptick. Compare volume: expansion on the engulfing day supports the idea that new demand arrived.
Contrast with bearish engulfing, the mirror version at tops. There, a small green day is followed by a larger red day whose body swallows the prior green body. Mentioning the bearish variant helps you avoid bullish bias. If you see bearish engulfing at resistance after a rally, respect the symmetry of the market: the same two-candle logic that marks bottoms can mark tops when context flips.
Spotting bullish engulfing on real charts
On a daily chart, scroll to a clear pullback within a longer uptrend or a corrective phase in a bear market that has stretched sentiment. Mark support where price bounced before. When the engulfing pair appears with its low holding that zone, note whether the pattern low gives you a clean stop reference. Traders often enter on the close of the engulfing candle or on a break above its high the next session. Both approaches seek confirmation that buyers are still present after the initial surge.
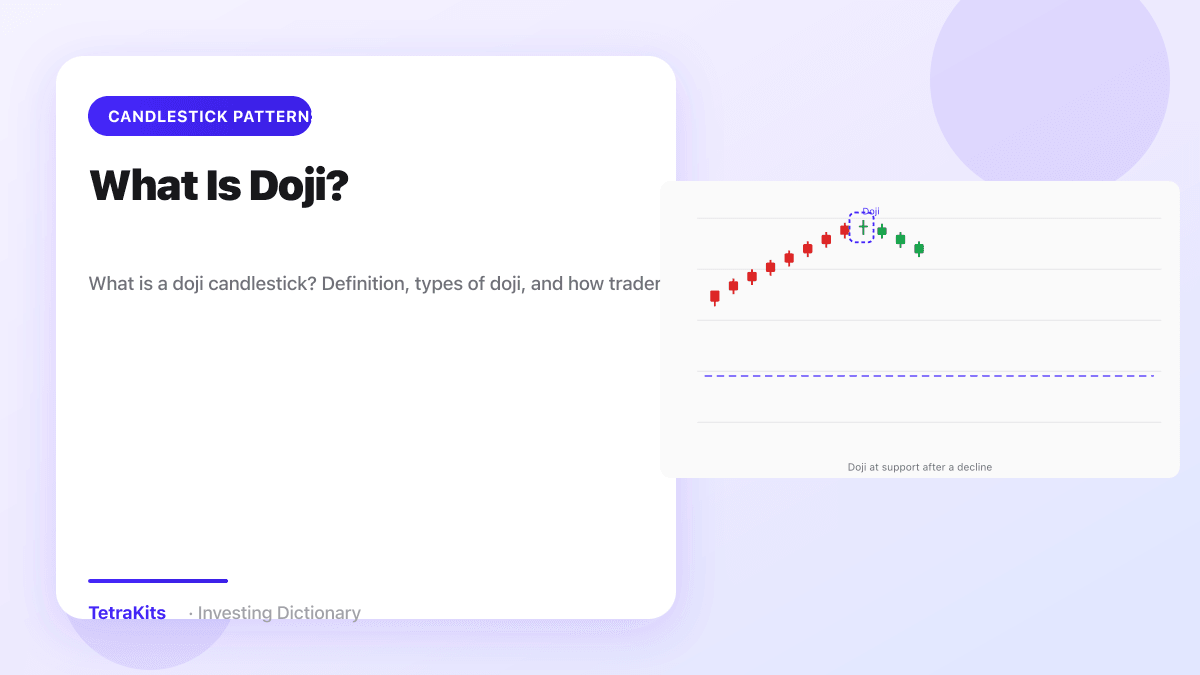
Look at the candles surrounding the pair. A doji or small-bodied bar before the engulfing day can show indecision that resolves bullishly. A hammer two days earlier plus an engulfing finish can form a micro base story. After the engulfing, watch for pullbacks that hold above the pattern midpoint or above the engulfing low; shallow retests often keep the reversal thesis alive.
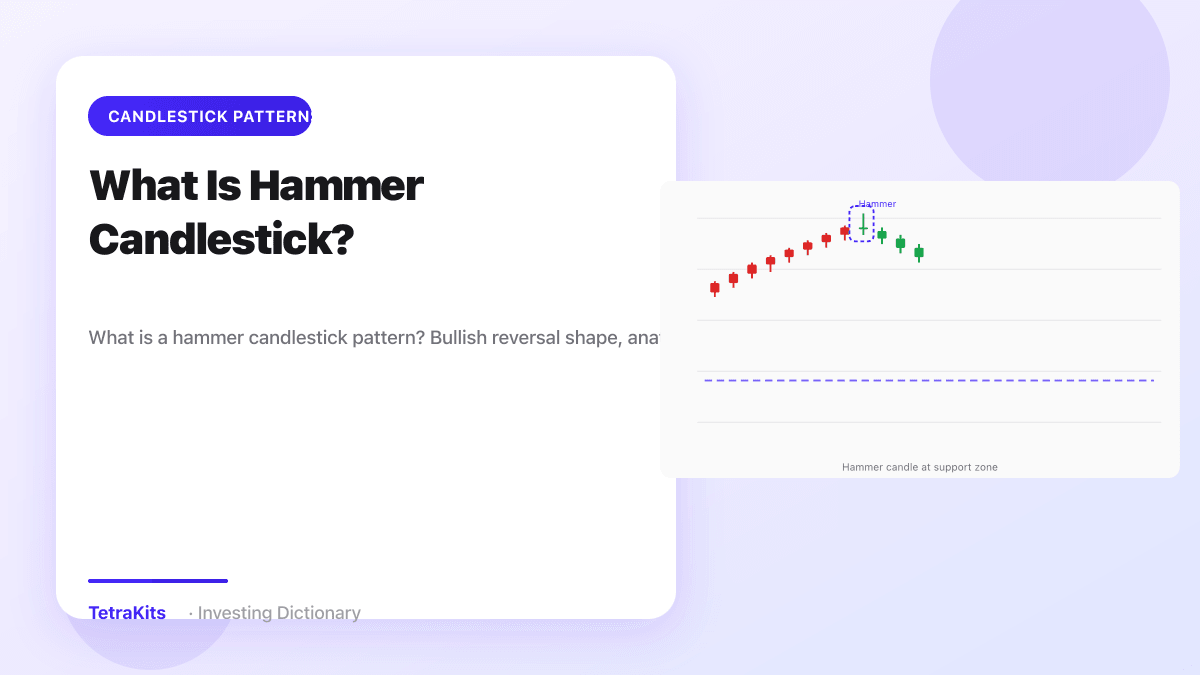
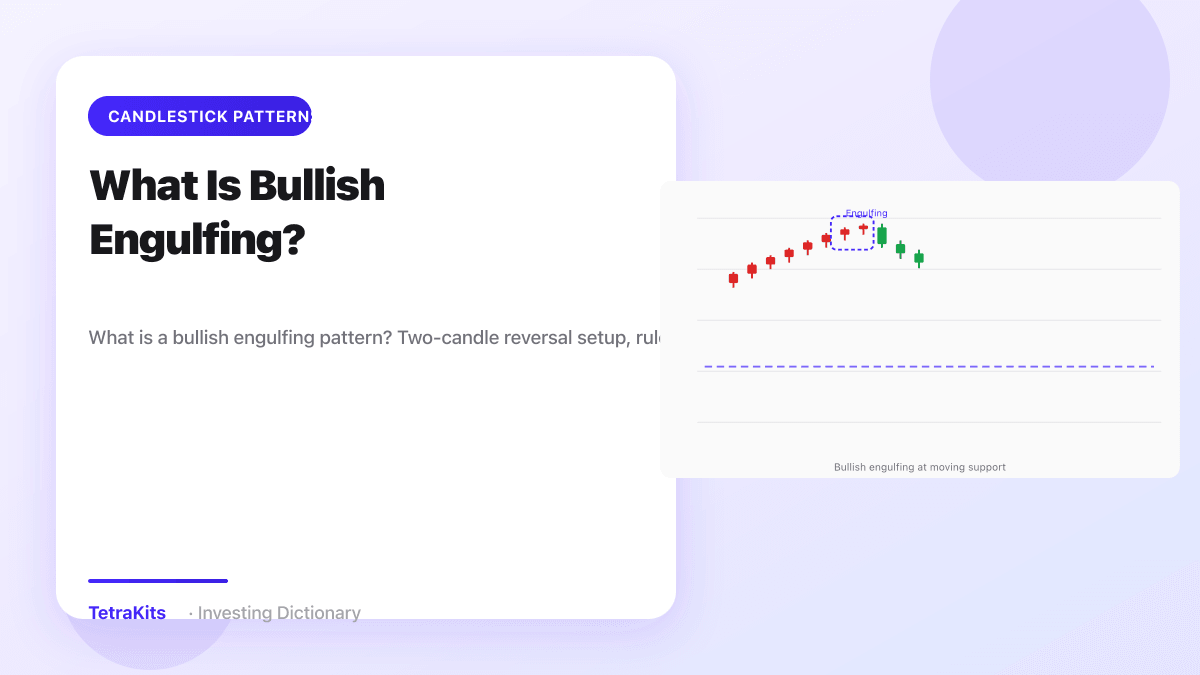
The chart illustration below shows the two-candle handoff inside a downtrend and near a support shelf, which is how you should train your eye: pattern plus location plus room above before you plan a trade.

Confirmation, stops, and common mistakes
Engulfing patterns lag slightly because you must wait for the second close. That delay is a feature: it filters impulsive entries on single wicks. Confirmation can include a third green day, a break of a short-term descending trendline, or RSI curling up from oversold without predicting the turn by itself. If price immediately reverses and closes below the engulfing low, treat the signal as failed and stand aside.
Stops typically sit below the engulfing pattern low or below support that framed the setup. Gap risk matters for overnight holds: earnings or macro news can skip through your stop. Size accordingly. Targets may aim at the nearest supply zone, a prior breakdown level now acting as resistance, or a fixed risk-multiple if you run a systematic plan.
Common mistakes include chasing engulfing candles that print far above support after a vertical snapback, ignoring the primary trend in a strong bear market, and requiring wick engulfing when only the body qualified. Another error is swapping time frames: an engulfing on a weekly chart is a major event; on a one-minute chart it may appear dozens of times per session. Read the full chart, demand location and volume, define risk under the pattern, and remember that bearish engulfing at tops uses the same logic in reverse.
Common questions
Does engulfing require full wick engulfing?
Classic definition focuses on bodies; some traders also want wick coverage.