What Is Doji?
What is a doji candlestick? Definition, types of doji, and how traders interpret indecision at support or resistance.
A doji is a candlestick where the open and close are nearly equal, leaving a thin or invisible real body and often long upper or lower shadows. It signals indecision: buyers and sellers traded actively during the session, but neither side held control by the close. On a full price chart, a doji rarely tells the whole story by itself. Its meaning depends on where it appears in the trend, whether it sits at support or resistance, and what the candles before and after it do.
How to spot a doji on a real chart
Start by zooming out. A doji on a five-minute chart during a lunch lull looks identical to a textbook example, but it may mean almost nothing. The same shape at the end of a multi-week rally, printed on a daily or weekly chart at a level where price failed before, deserves more attention. Look for a cross, plus sign, or tiny rectangle with wicks extending above and below. The body should be small relative to the total range. Many platforms label doji automatically, but manual review helps you judge whether the open-close gap is truly tight or just small enough to qualify on a noisy day.
Context matters more than geometry. Scroll left on the chart and ask what trend preceded the doji. After a sustained advance, a doji near a prior high can mark exhaustion. After a decline into a known support zone, it can show sellers lost momentum even if buyers have not taken over yet. Compare volume on the doji bar with recent sessions. Flat volume often fits a pause. Climax volume at a doji after a sharp move can mean a battle that ended in a draw, which sometimes precedes a reversal once one side commits on the next candle.
Common types appear often in live markets. A gravestone doji opens and closes near the low with a long upper shadow, suggesting rejection of higher prices. A long-legged doji has extended wicks both ways during volatility spikes. A dragonfly doji closes near the high with a long lower shadow, similar to a hammer but with a smaller body. Naming the subtype helps, but trend and level still drive the trade decision.
Doji at support, resistance, and trend extremes
Support and resistance turn a neutral doji into a decision point. Imagine a stock that declined for six weeks and bounced twice near $42. A doji forms on the third test of that zone. The pattern does not prove a bottom, but it shows selling pressure slowed at a place where buyers already stepped in before. That is a location edge, not a signal edge. Resistance works the same way in reverse. A doji under a ceiling where rallies stalled twice warns that upside may be limited until price clears the zone with conviction.
Traders who treat every doji as a reversal often churn their accounts in sideways markets. Ranges produce doji clusters because price naturally oscillates without a dominant trend. The mistake is acting on the shape alone. A better habit is to mark the doji, note the level, and wait for confirmation. Confirmation can be a strong bullish or bearish follow-through candle, a break of a short-term trendline, or alignment with an indicator such as RSI showing momentum shift. Some traders require the next session to close beyond the doji high or low before they adjust position size.
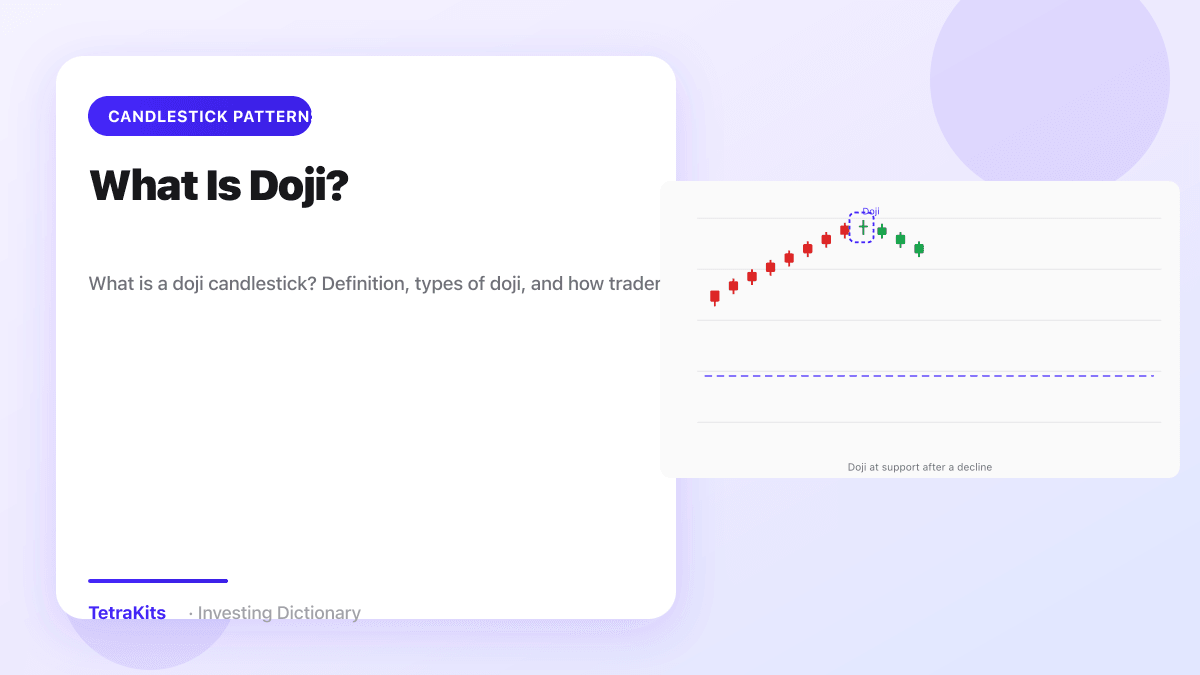
On the full chart below, notice how a single doji sits inside a larger story: prior trend, nearby swing highs and lows, and the space for price to travel if the pause resolves one way or the other. That is the view you want before risking capital.

Confirmation, risk, and common mistakes
Risk management around a doji should reference the full bar, not just the tiny body. If you lean bullish after a doji at support, a logical stop often sits below the doji low or below the support zone that framed the setup. If you lean bearish after a doji at resistance, risk frequently goes above the doji high. Because the body is small, the wick defines most of the invalidation distance. Size positions so that stop distance fits your plan; a wide long-legged doji in a volatile name can make the trade economically awkward unless you reduce shares.
Pair doji with two-candle patterns when possible. A doji followed by a wide green candle that engulfs the prior session may evolve into a bullish engulfing style handoff, even if the engulfing label strictly requires a red candle before the green one. The principle is the same: wait until buyers or sellers show follow-through. Similarly, a doji after an uptrend and then a shooting star like rejection on the next bar strengthens the case for caution on longs.
Avoid common beginner errors. Trading every doji without trend context is the main one. Ignoring the time frame hurts too: a doji on a one-minute chart is noise for a swing trader. Do not confuse a near-doji small body with a true equilibrium bar when the close still leans clearly bullish or bearish. Finally, do not treat doji as a guaranteed top or bottom. It flags that the current move paused. Your job is to read the full chart, respect the level, demand confirmation, and place stops where the story breaks if you are wrong.
Common questions
Is a doji always bearish?
No. It signals indecision. Bias depends on prior trend and follow-through.