What Is Double Bottom?
What is a double bottom pattern? W-shaped reversal, neckline confirmation, and example trade planning.
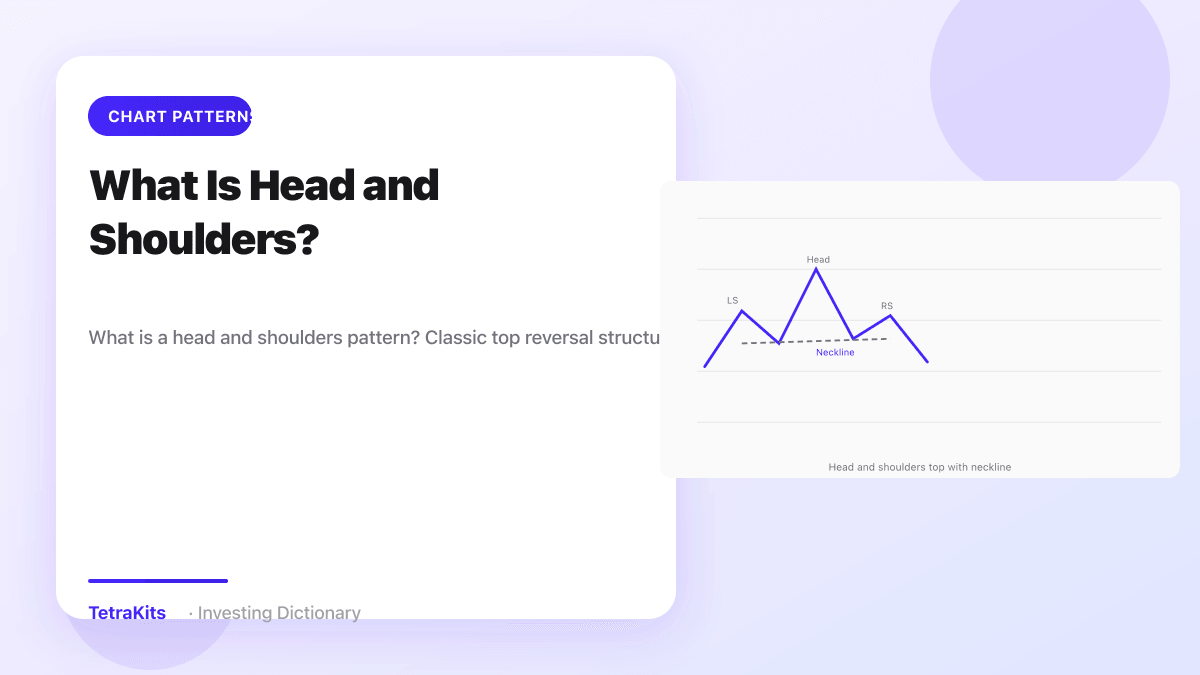
A double bottom is a bullish reversal chart pattern where price declines to a similar low twice, separated by a moderate bounce, forming a W shape before breaking above the peak between the two lows. That middle peak acts as the neckline. The pattern suggests sellers failed to push price to new lows on the second test and that buyers may be absorbing supply. Like all chart formations, it should be read on the full timeline with volume, symmetry, and a clear breakout plan rather than as two random dips.
The W shape, neckline, and spotting real doubles
On a daily or weekly chart, look for a downtrend that eases into a base. The first low marks initial support. Price bounces to a swing high, then rolls over again toward the prior low. The second low should land near the first in price and should not undercut it by much in a classic reading. If the second low crashes far below the first, you may be watching continuation selling, not a W. The bounce between the lows creates the neckline level traders watch for breakout confirmation.
Time symmetry helps separate intentional bases from noise. The two lows often form weeks or months apart in equities, though day traders see compressed versions on intraday charts. Compare the depth of the middle rally: a shallow bump suggests weak demand; a healthy rebound toward prior breakdown levels shows buyers can lift price meaningfully before the retest. Volume on the second low that is lighter than the first often supports the idea that selling pressure eased, though capitulation spikes on the second touch also appear in real bottoms.
Failed patterns teach as much as successes. A double bottom that breaks down on the second low becomes a continuation signal, not a reversal. Wait for neckline breaks before treating the W as confirmed. Premature entries above the first bounce high often get stopped out when price retests the lows again.
Neckline breakout, volume, and measured move
Confirmation for many traders is a close above the neckline with volume above recent average. The breakout day should show commitment: wide range, strong close, and follow-through the next session that holds the neckline as support on a retest. Retests are common. Price often dips to the broken peak area before continuing higher. That pullback can offer a lower-risk entry if the retest holds and volume dries up on the dip.
Measured move targeting adds structure to reward planning. Measure the distance from the lows to the neckline and project that distance upward from the breakout point. If the lows sit near $40 and the neckline near $48, the eight-dollar height projects a target near $56 after clearance. Real markets may stall at intermediate resistance or overshoot if momentum ignites. Use the math as a frame, not a promise.
The illustration below shows the double bottom on a complete chart with neckline and projected path, training you to see the W inside trend context instead of as two isolated candles at the lows.

Failed patterns, risk, and common mistakes
Stops often sit below the second low or below the lower of the two lows with a small buffer. If that level breaks, the reversal thesis is invalid and downside may accelerate. Position sizing should reflect the distance to the stop and the possibility of gap risk around earnings or macro events. Some traders enter half size on the neckline break and add on a successful retest to balance confirmation against opportunity cost.
Relate double bottoms to nearby structures. A W at the end of a decline can overlap with an inverse head and shoulders if the middle rally is uneven. A bullish engulfing pair on the second low adds candlestick evidence. After breakout, a bull flag consolidation can continue the new uptrend. At tops, contrast with double tops, the bearish mirror that breaks down through support between two highs.
Common mistakes include calling every double tap of a level a double bottom without a neckline break, ignoring that the second low undercut the first invalidates the classic pattern for strict traders, and chasing vertical breakouts far above the neckline where risk-reward collapses. Another error is neglecting the broader market trend: a valid W on one stock can fail when the index sells off sharply. Read the full chart, demand volume on the break, place stops under the lows, use measured moves as guides, and respect failed Ws as continuation warnings.
Common questions
Double bottom vs cup and handle?
Cup and handle is a longer rounded base with a smaller pullback; double bottom is sharper with two distinct lows.