What Is Morning Star?
What is a morning star pattern? A three-candle bullish reversal with a star gap down and strong third candle confirming buyers.
A morning star is a three-candle bullish reversal pattern that appears after a decline and suggests buyers may be regaining control. The sequence starts with a long bearish candle, continues with a small-bodied star that gaps or drifts lower, and finishes with a strong bullish candle that closes well into the first candle body. The middle bar shows indecision after selling pressure, and the third bar confirms that demand returned with force. Like all candlestick formations, it earns weight when you read it on a full chart near support with volume and follow-through, not as three isolated bars in a random range.
Three candles, gaps, and what qualifies
Day one should reflect real weakness: a wide red candle in a downtrend or sharp pullback. Day two is the star: a small real body, often with upper and lower wicks, that opens below the prior close and trades without extending the decline much further. Classic teaching prefers a gap between day one and day two, but modern markets gap less often on dailies; a clear pause with a compact body still counts when context is strong. Day three must be bullish and substantial, closing into at least the midpoint of day one body and ideally above day one open.
Zoom out before you label the pattern. A morning star in the middle of a sideways chop is usually noise. A morning star after a multi-week decline, printing at a prior swing low, round number, or rising moving average, tells a different story. Compare day three range to average true range: a decisive green bar suggests committed buying. Volume expansion on the third day supports the reversal narrative, though some bottoms form on quiet third candles that still hold on retest.
Contrast with evening star, the bearish mirror at tops after rallies. Evening star uses a long green first candle, a small star, then a strong red third candle closing deep into the first body. Mentioning the bearish variant keeps you from bullish bias on every three-bar pause. Pair morning star logic with single-candle tools: a hammer one session earlier can foreshadow the same support story in compressed form.
Reading morning star on full charts
On a daily chart, scroll to a downtrend that is aging into a base. Mark support where price bounced before or where a double bottom may be forming. When the three-candle sequence appears with its low holding that zone, note whether the pattern low offers a clean stop reference. Traders often enter on the close of the third candle or on a break above its high the next session. Both tactics seek proof that buyers remain active after the initial surge.
Study neighbors around the trio. A doji cluster before day one can show exhaustion before the long red bar. A bullish engulfing two sessions after the morning star can reinforce the same zone with a second reversal signature. After the pattern, watch for pullbacks that hold above the star low or above the third candle midpoint; shallow retests often keep the bull thesis intact while deep closes below the star invalidate it.
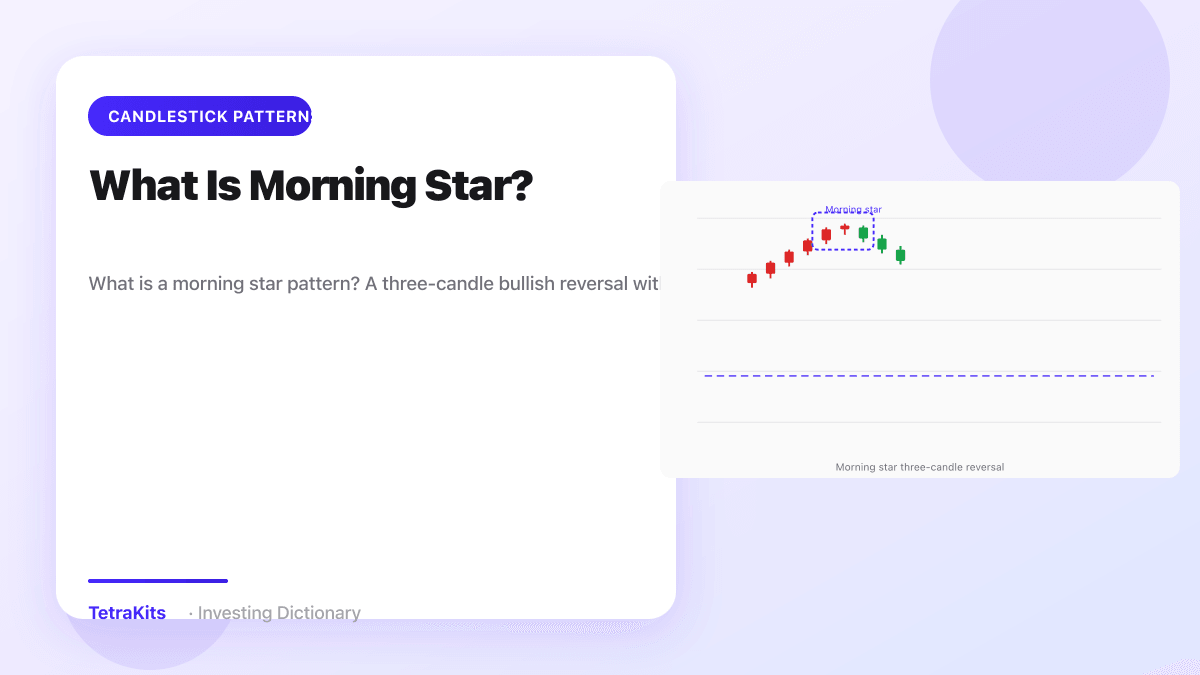
The chart illustration below shows the three-candle handoff inside a decline and near a support shelf, which is how you should train your eye: sequence plus location plus room above before you plan a trade.

Confirmation, stops, and common mistakes
Morning star patterns lag because you need the third close before acting. That wait filters entries on a lone hammer wick or a single star bar without confirmation. Additional evidence can include a fourth green day, a break of a short-term descending trendline, or RSI curling up from oversold without calling the turn by itself. If price reverses and closes below the star low or below the morning star pattern low, treat the signal as failed.
Stops commonly sit below the star low, below the entire pattern low, or below support that framed the setup. Gap risk matters around earnings and macro events. Size positions knowing overnight moves can skip your level. Targets may aim at the nearest supply zone, a prior breakdown level now acting as resistance, or a measured move from the base if you combine the candle signal with chart structure.
Common mistakes include labeling every small middle candle after a red bar as a star without a strong third day, ignoring location in a strong bear market, and requiring perfect gaps when bodies and closes tell the story on modern charts. Another error is swapping time frames: a morning star on a weekly chart is a major event; on a one-minute chart similar shapes appear constantly. Read the full chart, demand support context and volume on the third candle, define risk under the pattern, and remember evening star at resistance applies the same three-candle logic in reverse.
Common questions
Morning star vs hammer?
Hammer is one candle with long lower wick. Morning star is a three-candle sequence with a middle star bar.