What Is Support and Resistance?
What is support and resistance? Price levels where buying or selling pressure historically concentrated and how traders use them.
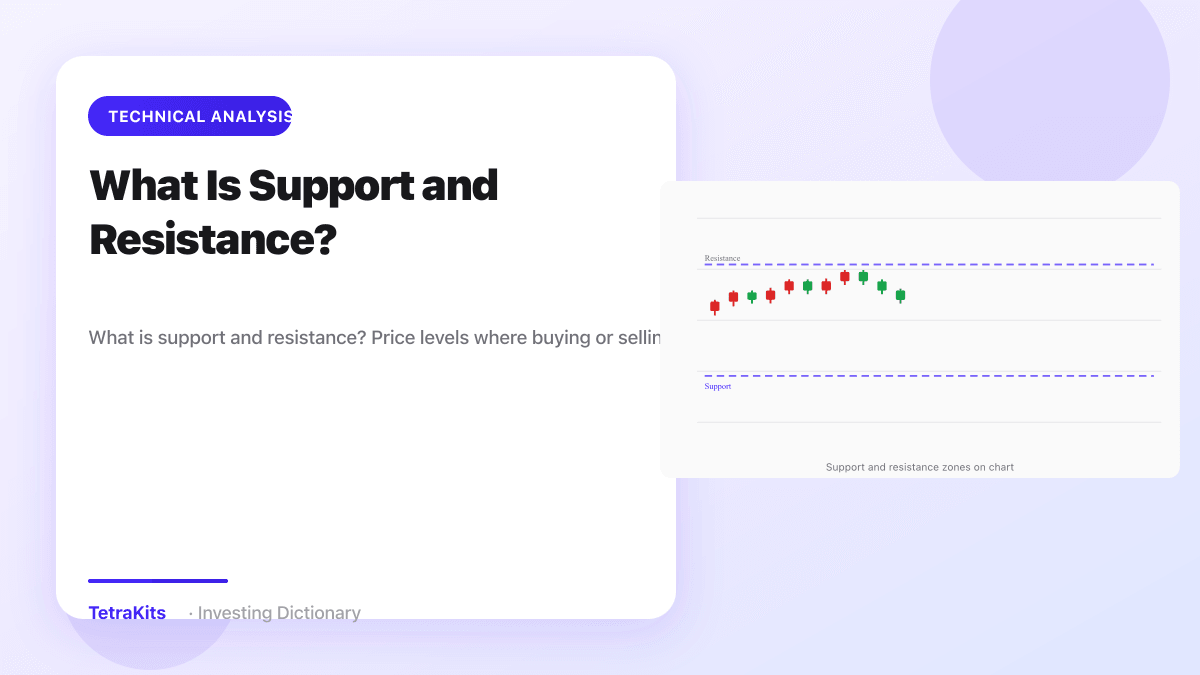
Support and resistance are price zones where buying or selling pressure has repeatedly slowed or reversed a move. Support sits below current price, where demand has historically absorbed supply. Resistance sits above, where sellers have capped rallies. Neither level is magic; both reflect memory, positioning, and the psychology of traders who remember where price stalled before.
How Support and Resistance Form
Prior swing highs and lows are the most common anchors. A stock that bounced three times near $40 builds recognition: dip buyers place orders there, and shorts cover into the same zone. Round numbers like $50 or $100 also attract attention because humans cluster orders at easy figures.
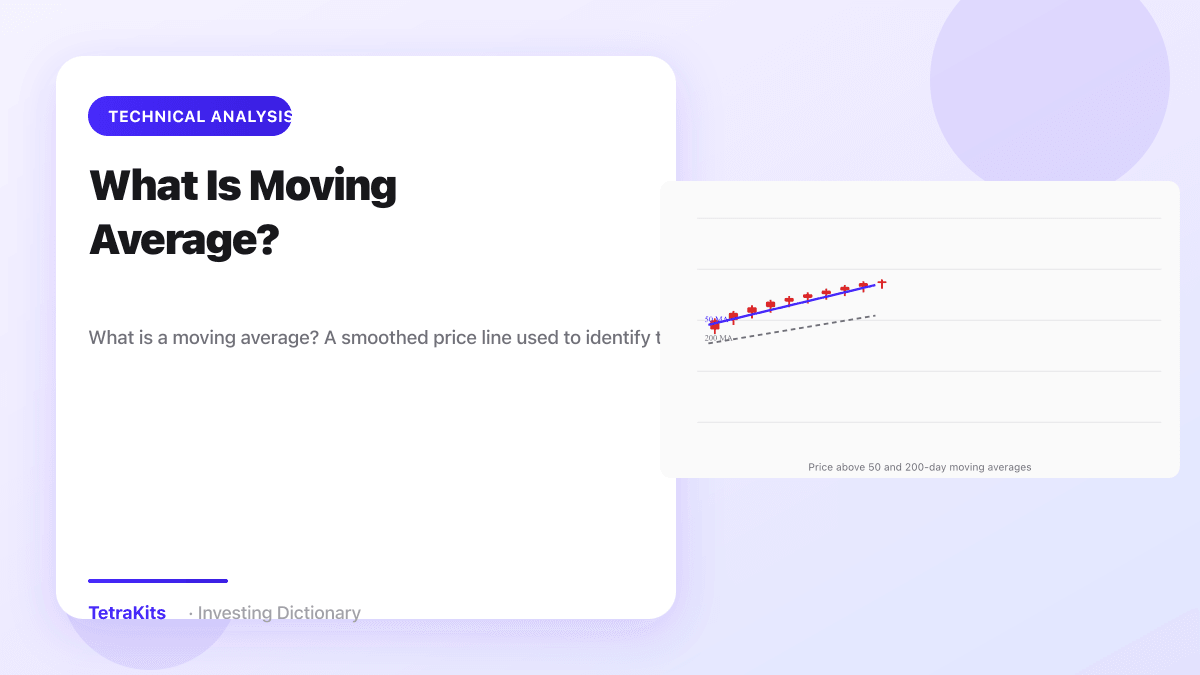
Moving averages, trendlines, and Fibonacci retracements can act as secondary support or resistance when they overlap with price history. Volume profile tools show where the most shares changed hands, creating high-volume nodes that price revisits. The more confluence you see at a zone, the more traders tend to react when price returns.
Markets rarely respect a single tick forever. Most professionals draw zones rather than hairline levels, expecting wicks to pierce slightly before a reaction or failure. Treating a zone as a band reduces frustration when price overshoots by a few cents and still reverses.
Trading Breakouts and Retests
When price breaks above resistance on strong volume, that level often flips to support on a pullback. Traders call this a role reversal or polarity flip. The first retest after a clean breakout is a classic entry pattern: old sellers who missed the move sometimes buy back, and new bulls defend the level they just conquered.
Failed breakouts are equally important. A spike above resistance that immediately falls back traps buyers who chased the move. Those trapped longs may sell on the next approach, turning resistance even stronger. Watching how candles close relative to the zone matters more than an intraday wick that quickly fades.
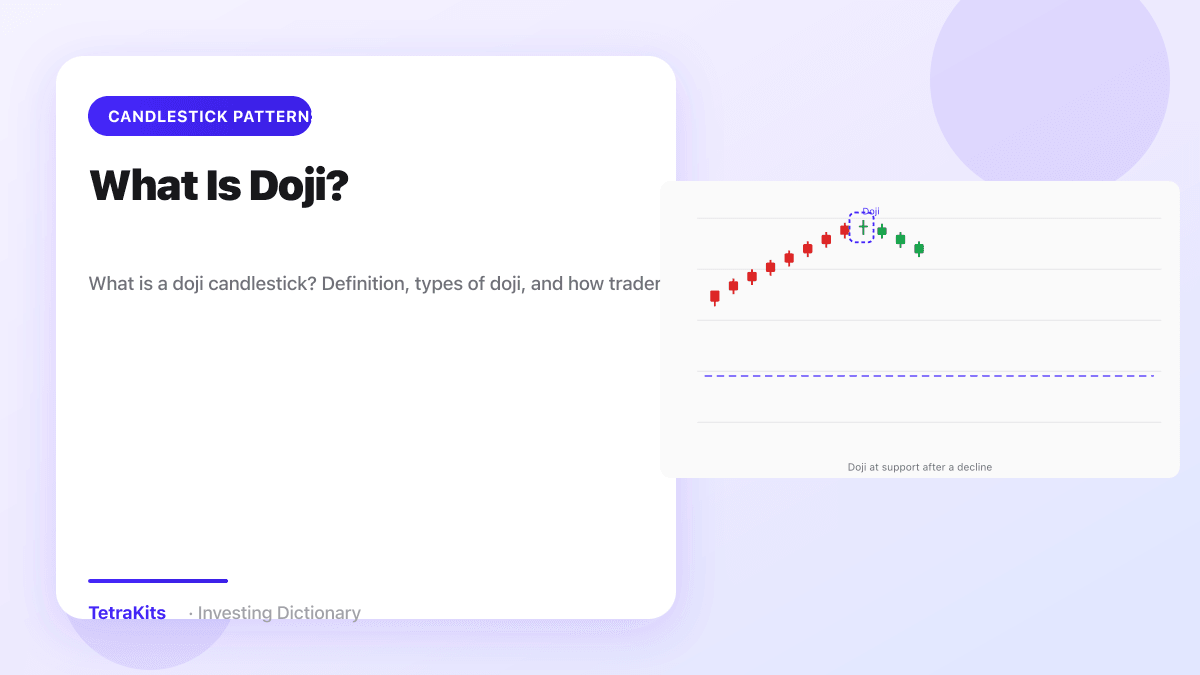
Combine horizontal levels with moving averages and candlestick context. A doji at resistance after an extended rally suggests indecision; a wide-range bullish close through resistance suggests commitment. Structure beats any single indicator reading.

Timeframe and Strength
A level that holds on a five-minute chart may mean little on a weekly chart, and vice versa. Monthly support on a major index carries more weight than intraday noise on a small-cap name. Always note which time frame produced the level you are trading.
Each successful test can strengthen a zone as more participants anchor to it, but levels also weaken over time. Old highs from five years ago matter less if the business, index membership, or macro regime has changed completely. Refresh your map as new swings print.
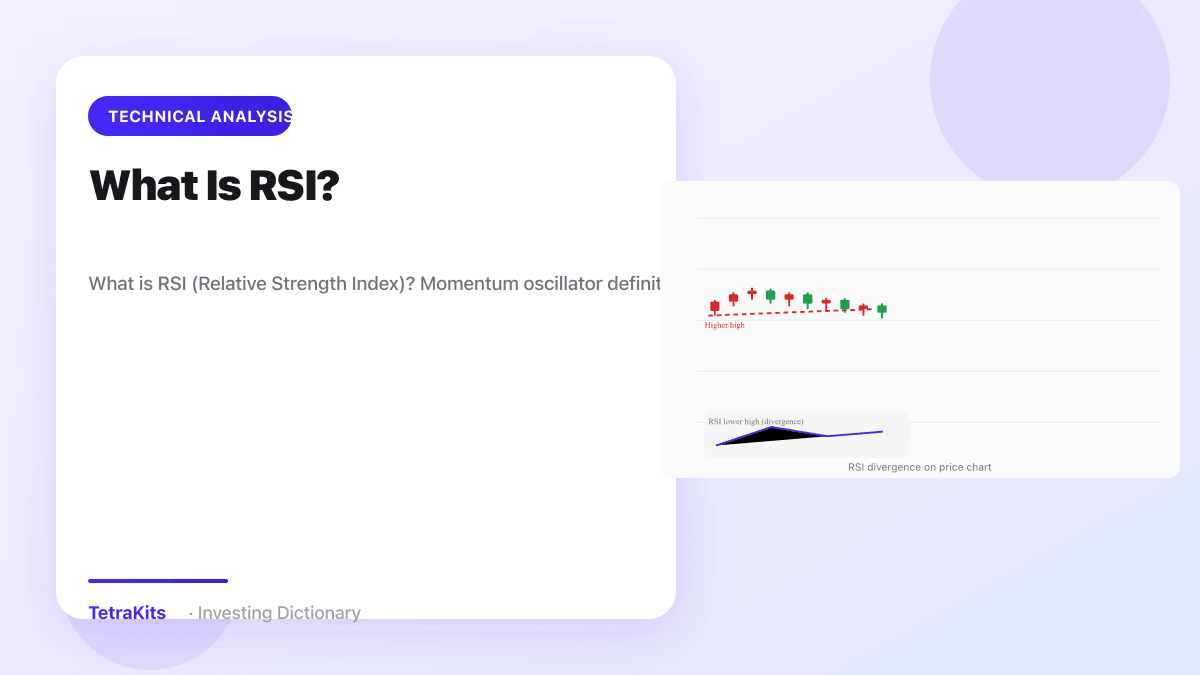
RSI divergences near support or resistance add nuance: price may make a new high while momentum fades, warning that the level might not hold much longer. Divergence is not a guarantee, but it prompts tighter risk control near key zones.
Common Mistakes to Avoid
Drawing too many lines creates clutter and false confidence. Focus on the most recent, most obvious highs and lows that price has respected multiple times. Chasing every minor pivot leads to analysis paralysis.
Assuming support must hold is another trap. Strong trends slice through levels that worked for months. In bear markets, bounces at support are often short-lived relief rallies rather than durable bottoms. Fundamentals and broad trend direction still override a line on a chart.
Support and resistance work best as planning tools: where to look for entries, where to place stops, and where to take partial profits. They describe where battle lines formed in the past. Your edge comes from how you respond when price reaches those lines again, not from the lines themselves.
Institutional algorithms often cluster orders around the same visible levels retail traders draw, which can reinforce self-fulfilling behavior near major zones. That does not make every line reliable forever, but it explains why certain prices attract repeated reactions. Update your map after major trend changes so you are trading current structure, not ghosts from an old range.
Common questions
Exact price or zone?
Most traders treat levels as zones because markets rarely respect a single tick repeatedly.