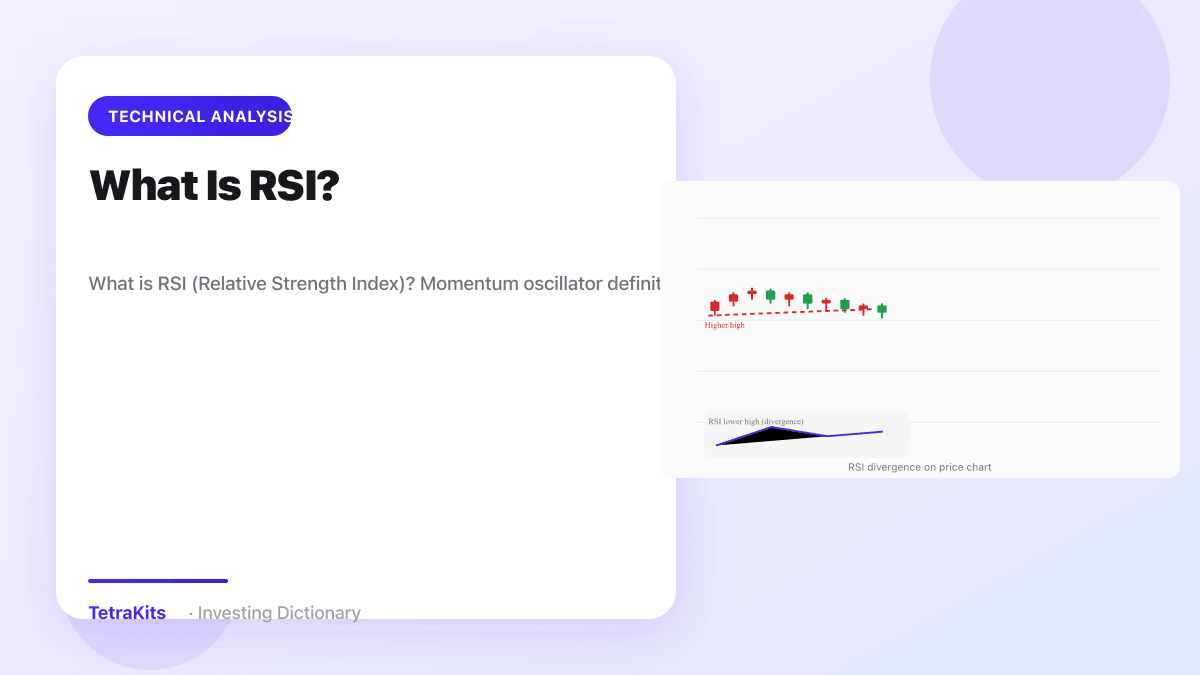
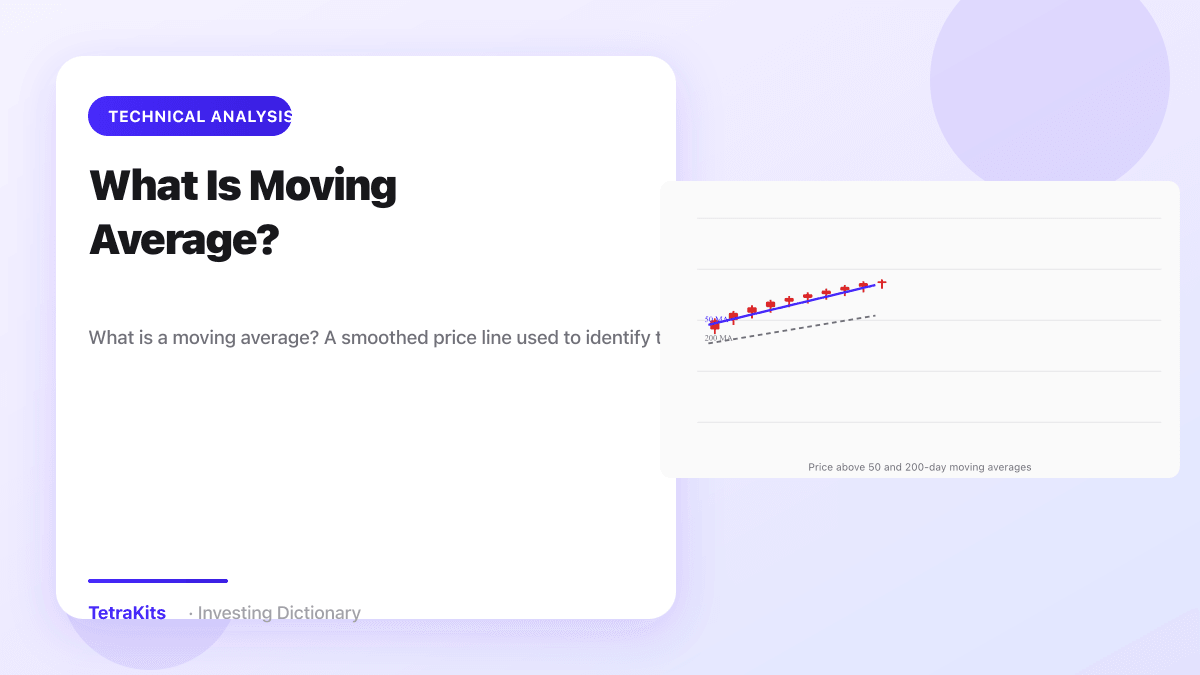
What Is Moving Average?
What is a moving average? A smoothed price line used to identify trend direction, with SMA vs EMA and common periods like 50 and 200 day.
A moving average smooths price data by averaging closing prices over a fixed number of periods. Instead of reacting to every tick, the line rolls forward as new bars arrive and old ones drop off. Traders use moving averages to see trend direction, filter noise, and spot crossovers between short and long horizons. The concept is simple, but how you choose the type and period changes what the chart tells you.
SMA vs EMA
The simple moving average, or SMA, adds the last N closes and divides by N. A 20-day SMA treats each day equally. The exponential moving average, or EMA, gives more weight to recent prices, so it turns faster when momentum shifts. Both appear on virtually every charting platform, often overlaid directly on price.
Neither formula predicts the future. They describe what already happened over the window you selected. A 50-day average on a daily chart reflects roughly two and a half months of trading. On a weekly chart, the same 50 periods cover nearly a year. Always match the time frame to your holding period rather than copying defaults from social media screenshots.
Some traders stack several averages at once, such as 9, 21, and 50 periods, to watch alignment. When shorter lines sit above longer ones, bulls often treat the structure as supportive. When they invert, caution rises even if the headline trend has not fully reversed yet.
Reading Trend on the Chart
Price above a rising moving average often signals an uptrend; price below a falling average suggests the opposite. Many investors watch the 50-day and 200-day lines on U.S. equities because pension funds and index strategies reference them. When the 50-day crosses above the 200-day, some call it a golden cross. When it crosses below, they call it a death cross. These events get press coverage, but they lag price and work better as context than as standalone buy or sell triggers.
Moving averages also act as dynamic support and resistance. In strong trends, pullbacks that touch the 20-day or 50-day line sometimes bounce as buyers step in. In choppy ranges, price may slice through averages repeatedly, producing whipsaws for anyone trading every crossover blindly.
Pair averages with support and resistance zones drawn from prior highs and lows. A pullback to a rising 50-day line that coincides with a prior breakout level tells a stronger story than either signal alone.

Common Periods and Settings
The 10 and 20-period averages suit short-term swing traders who want quick feedback. The 50-day line balances responsiveness with enough smoothing for intermediate trends. The 200-day line is the long-term benchmark many allocators cite when discussing bull or bear market regimes.
Intraday traders might use 9 and 21 on five-minute charts; position traders might plot 100 and 200 on weekly data. There is no universally correct setting. What matters is consistency within your system and honest backtesting before you risk real capital.
Volume-weighted moving averages exist but are less common than SMA and EMA. MACD builds on EMA math, so learning moving averages first makes that oscillator easier to interpret. RSI complements trend tools by flagging when momentum stretches, especially near average-based support.
Limits of Moving Averages
Moving averages are lagging indicators by design. They confirm trends after price has already moved, which means late entries and late exits unless you combine them with other rules. Sharp gap opens can leave price far from an average overnight, making "touch the MA" plans impossible to execute at the expected level.
Low-priced or thinly traded stocks can produce misleading average behavior when a single large print distorts the window. Crypto markets, which trade around the clock, never have the same session gaps as equities but can trend so violently that even fast EMAs lag meaningful turns.
Use moving averages to organize your view of trend, not to replace risk management. Stops, position sizing, and fundamental context still matter. The smoothed line is a map, not the territory.
Common questions
Golden cross vs death cross?
Golden cross is when a short MA crosses above a long MA. Death cross is the opposite.