What Is MACD?
What is MACD? Moving Average Convergence Divergence explained with signal line crossovers and histogram.
MACD, short for Moving Average Convergence Divergence, is a trend-following momentum indicator that shows the relationship between two exponential moving averages of price. Created by Gerald Appel, it appears as a MACD line, a signal line, and a histogram below the price chart. Traders watch crossovers and histogram expansion to judge whether bullish or bearish momentum is building or fading.
MACD Line and Signal Line
The MACD line is typically the 12-period exponential moving average minus the 26-period EMA. When the shorter average sits above the longer one, MACD is positive, reflecting upward momentum. When the shorter average falls below, MACD turns negative. Exponential moving averages weight recent prices more heavily than simple moving averages, so MACD reacts faster to new information.
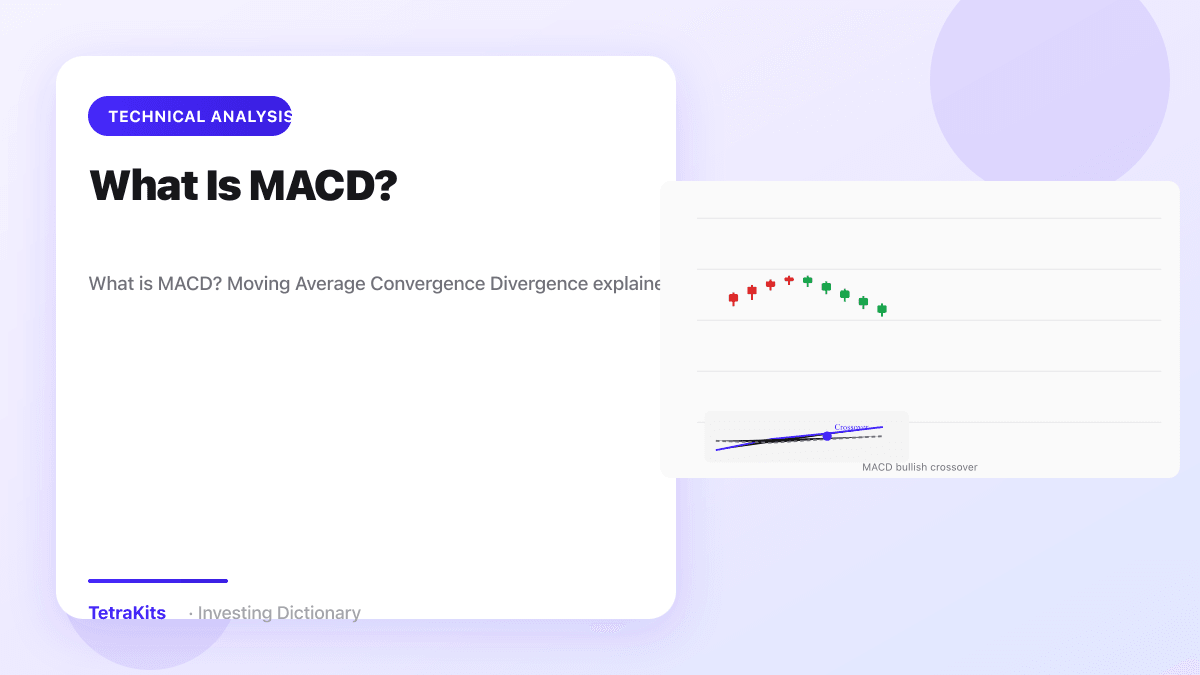
The signal line is a 9-period EMA of the MACD line itself. It smooths the raw MACD and generates the crossover signals many traders follow. When MACD crosses above the signal line, the interpretation is that momentum is improving. A cross below suggests weakening momentum. These events are easy to spot visually, which partly explains MACD's enduring popularity in retail education.
Because both components are built from moving averages, MACD inherently lags price. It confirms moves more often than it leads them. That lag reduces false signals in strong trends but produces whipsaws when price oscillates in a tight range without direction.
Histogram and Momentum Strength
The histogram plots the distance between the MACD line and the signal line. Bars above zero grow taller as MACD pulls away from the signal line upward, indicating strengthening bullish momentum. Shrinking bars warn that momentum is slowing even if MACD remains positive. Bars flipping below zero mark bearish crossover territory.
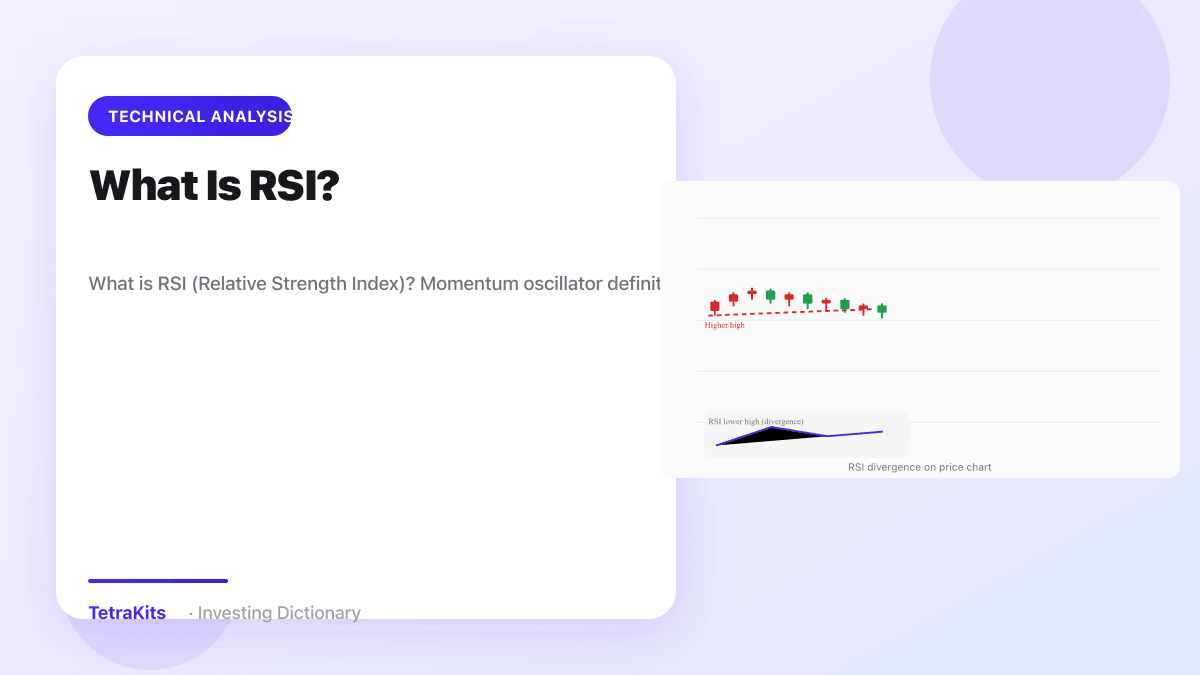
Histogram peaks sometimes align with short-term exhaustion points. A price high accompanied by a lower histogram high mirrors the divergence concept used in RSI: price pushes further while momentum metrics do not confirm. Not every divergence reverses trend, but combined with support or resistance it can improve timing.
Zero-line crosses occur when MACD moves from negative to positive or vice versa, signaling a broader shift in the balance of the two EMAs. Some traders weight these more heavily than signal-line crosses because they reflect the primary trend filter rather than a short smoothing layer.

Crossovers and Trading Interpretation
Signal-line crossovers are the most cited MACD events. A bullish cross after a prolonged decline might coincide with a basing pattern breaking higher. A bearish cross after an extended rally can warn longs to tighten stops. Frequency of crossovers rises in sideways markets, which is why filtering by higher-time-frame trend reduces noise.
MACD works best when aligned with price structure: breakouts from ranges, pullbacks to moving averages in trends, or reactions at prior highs and lows. Entering on every cross without regard to context invites repeated small losses that add up.
Compare MACD behavior across assets. Volatile small caps generate larger histogram swings than sleepy large caps. Crypto markets, including tokens on networks like Ethereum, may need wider stops or adjusted settings because 24/7 trading and gapless sessions change volatility profiles versus regular stock hours.
Settings and Limitations
The default 12, 26, 9 parameters come from Appel's original work on daily charts. Intraday traders sometimes shorten periods for faster signals; swing traders on weekly charts may lengthen them. There is no universally optimal setting; tuning should connect to the asset's volatility and your holding period, then be validated with forward testing rather than curve fitting past data.
MACD shares limitations with other lagging indicators. It will miss the first leg of a V-shaped reversal and stay bullish well into a topping process if price drifts sideways. It does not incorporate volume directly, though practitioners often read volume separately when MACD confirms a breakout.
Pair MACD with complementary tools such as RSI for overbought context or trend lines for structure. MACD summarizes moving average relationships in one compact panel, making it a durable starting point for learning momentum. Respect its lag, demand price confirmation, and it becomes a useful part of a disciplined process rather than a substitute for one.
Common questions
MACD settings?
12,26,9 is classic; traders tune for asset volatility.