What Is Elliott Wave Theory?
What is Elliott Wave Theory? Five-wave impulses, ABC corrections, and Fibonacci relationships with diagram.
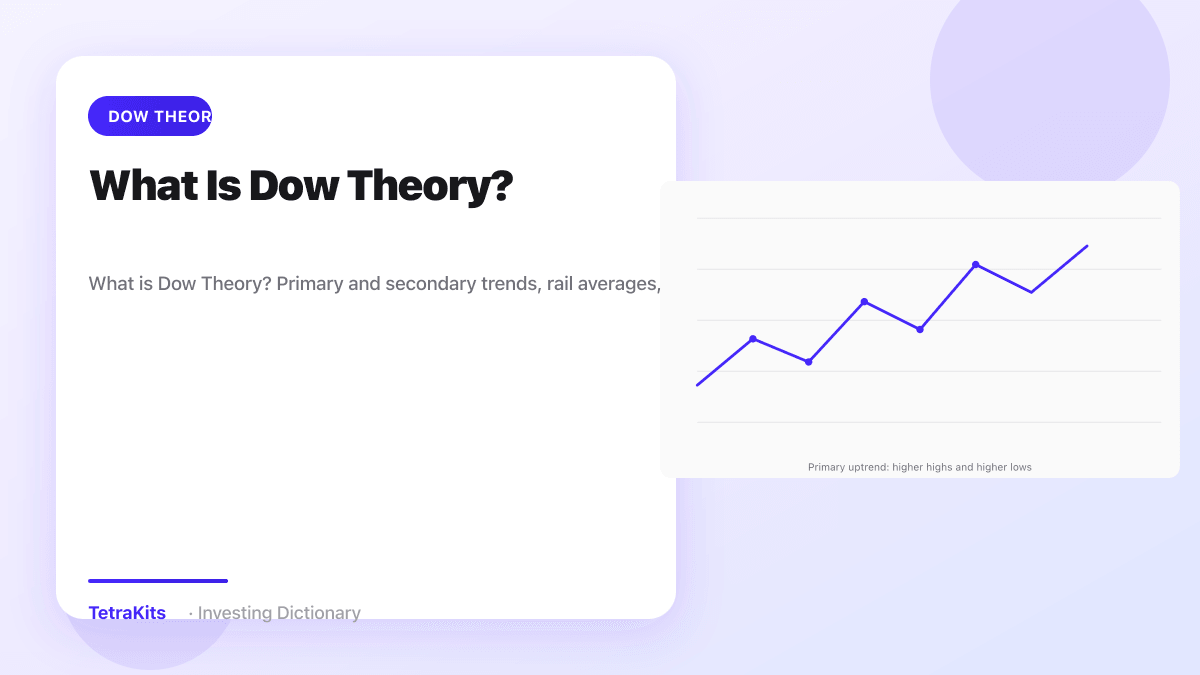
Elliott Wave Theory is a form of technical analysis that proposes financial markets move in repetitive wave patterns driven by crowd psychology. Ralph Nelson Elliott developed the framework in the 1930s after studying decades of market data. The core idea is that trends advance in five-wave impulses and retrace in three-wave corrections, with patterns repeating across multiple time scales from minutes to decades.
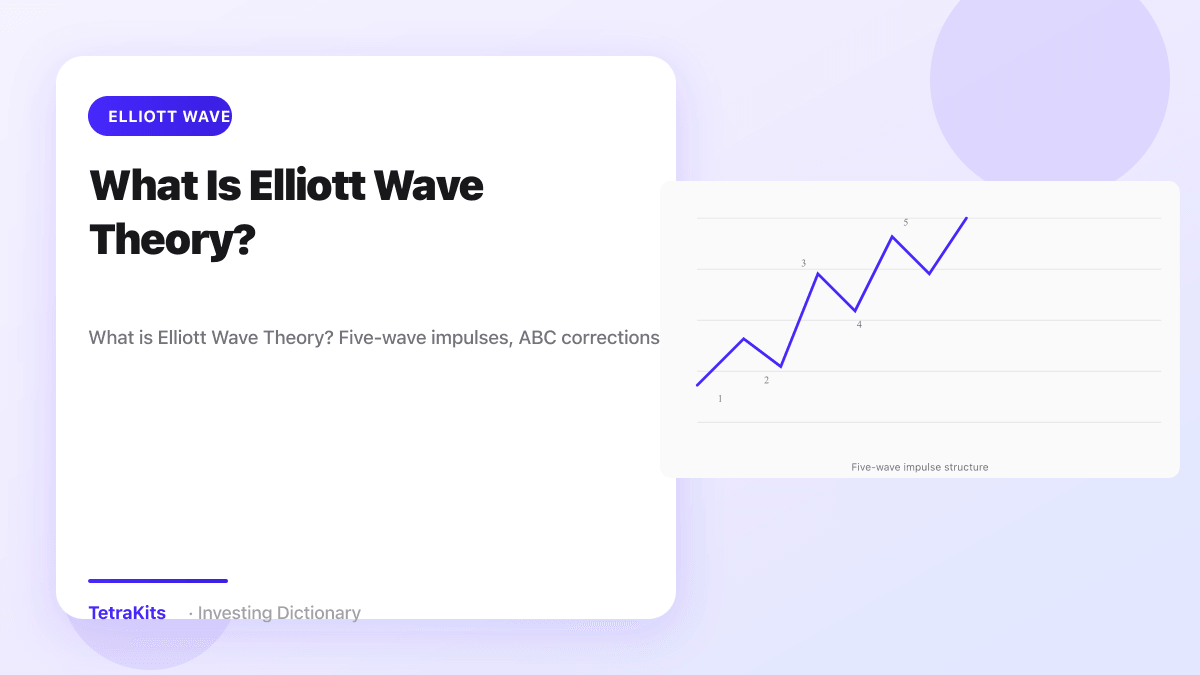
Five-Wave Impulse Structure
In the direction of the larger trend, Elliott labeled five sub-waves: 1, 2, 3, 4, and 5. Waves 1, 3, and 5 move with the trend; waves 2 and 4 pull back against it. Wave 3 is often the longest and strongest, though not always. Wave 2 typically retraces a portion of wave 1 but should not exceed its starting point. Wave 4 should not overlap the price territory of wave 1 in stock index contexts, one of the hard rules practitioners use to reject invalid counts.
Impulse waves subdivide into smaller five-wave structures on lower time frames, creating a fractal appearance. A wave 3 on a daily chart might contain a complete five-wave minute-chart rally inside it. This nesting is powerful for analysts who enjoy hierarchical maps of market structure and frustrating for those who want a single unambiguous label.
Extensions occur when one motive wave, often wave 3 or 5, stretches far longer than the others. Truncations happen when wave 5 fails to exceed wave 3's peak, sometimes signaling exhaustion before a larger correction. Recognizing these variations takes practice and humility when the market refuses to fit a preferred count.
ABC Corrections and Retracements
After a five-wave impulse completes, price often corrects in three waves labeled A, B, and C against the prior trend. Corrective patterns take many forms: sharp zigzags, flat corrections where B retraces most of A, or complex combinations that frustrate traders seeking clean shapes.
Fibonacci ratios guide retracement expectations. Common targets for wave 2 or wave 4 pullbacks include 38.2%, 50%, and 61.8% of the prior wave. Extensions frequently relate to 1.618 or 2.618 multiples of earlier swings. Elliotticians overlay Fibonacci grids on charts alongside wave labels, though the market frequently stops between canonical levels.
Corrective phases can last longer than impulse legs in time even when they cover less price distance. Sideways corrections confuse newcomers who expect every pullback to look like a sharp V. Patience and alternate counts help navigate ambiguous stretches.

Fibonacci and Wave Rules
Fibonacci numbers appear throughout Elliott's structure: 5 and 3 wave counts, relationships between wave lengths, and time durations. Tools like retracement boxes and extension projections are standard in Elliott software packages. The math provides concrete targets when psychology alone feels vague.
Hard rules filter bad counts. Wave 3 cannot be the shortest among waves 1, 3, and 5. Wave 4 overlap restrictions apply to certain asset classes. Violations force relabeling rather than forcing the market to comply. Soft guidelines, such as alternation between waves 2 and 4 in depth and form, guide expectations without guaranteeing outcomes.
Elliott Wave pairs naturally with other methods. Dow Theory's primary trend might align with a larger-degree wave 3 impulse. Momentum tools like MACD can confirm wave 5 divergences. No single rulebook wins every debate; confluence strengthens conviction.
Subjectivity and Practical Use
The chief criticism of Elliott Wave is subjectivity. Two skilled analysts can publish different valid counts on the same chart, especially mid-correction. Retroactive relabeling after the fact erodes confidence for skeptics. Real-time traders must commit to a primary scenario, define invalidation levels, and adjust when price violates the count.
Elliott Wave works best as a probabilistic roadmap rather than prophecy. Expecting an ABC pullback after five waves up suggests where to watch for support, not a guarantee the low will land exactly at 61.8%. Combining wave labels with stops and position sizing keeps the framework actionable.
Learning curve is steep. Beginners often force minor swings into major labels, overtrade wave 4 dips, or chase extended fifth waves without risk control. Structured education, journaling, and comparing alternate counts build skill over time.
Despite debates, Elliott Wave persists in institutional and retail research because it organizes chaos into sequences. Whether you adopt it fully or borrow pieces like Fibonacci retracements, understanding five-wave impulses and ABC corrections clarifies how trend traders think about progression and pullback, and why Dow Theory trend degrees still echo in modern wave degree notation today.
Common questions
Can waves fail?
Yes. Invalidated counts require relabeling; discipline matters.